

LUNAMARINA/iStock via Getty Images
LUNAMARINA/iStock via Getty Images
This is an abridged version of the full report published on Hoya Capital Income Builder Marketplace on August 19th. In our quarterly State of the REIT Nation, we analyze the recently-released NAREIT T-Tracker data.

Hoya Capital
Hoya Capital
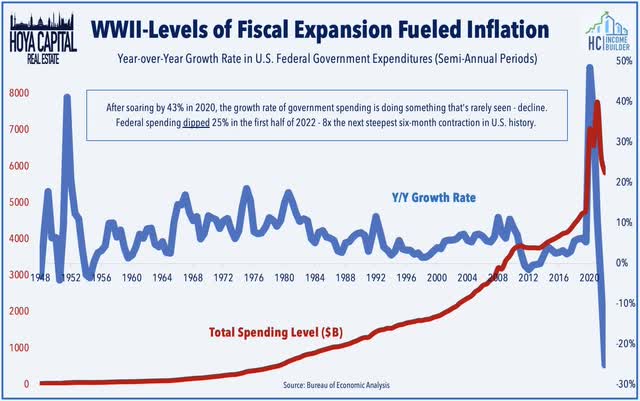
Following a decade of the “lower for longer” macroeconomic environment that was incredibly persistent and durable in retrospect, the pandemic era has been defined by sudden shifts in “economic regimes” that seem to befuddle economists and policymakers even more than usual. Just as policymakers are seemingly going “all-in” in a crusade against inflation, the current regime of synchronized fiscal expansion and persistently elevated inflation is suddenly under siege by the deflationary effects of deteriorating economic conditions in Europe and Asia and global fiscal contraction. After soaring by 43% in 2020 and expanding another 3.4% from there in 2021 – a level of fiscal intervention that exceeded that of WWII and fueled the highest inflation rates in four decades – the growth rate of government spending is doing something that’s rarely seen in U.S. history – decline. Federal spending dipped 25% in the first half of 2022 – 8x the next steepest six-month contraction in U.S. history.
Hoya Capital
Hoya Capital
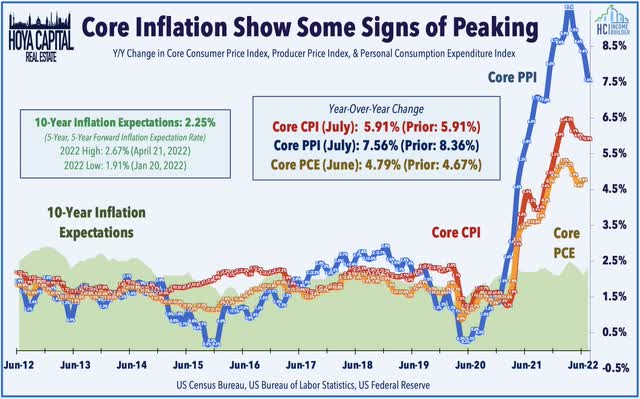
Just as policymakers and economists went to extreme lengths to blame nearly everything besides soaring government spending for the four-decade-high levels of inflation, there appears to be a similar unwillingness to concede that lower government spending will also likely be inflation’s most effective antidote, and that’s just what we’ve been seeing in recent months across the consumer and producer inflation reports. Fueled by this data showing a potential peaking in inflationary pressures in the U.S., the benchmark 10-Year Treasury Yield has pulled back from a peak of 3.50% in mid-June to roughly 3.0% today following a surge from late 2021 through mid-2022 that triggered in a historic sell-off across bond markets.
Hoya Capital
Hoya Capital
After shouldering much of the “costs” of the early-pandemic recovery through the surge in inflation to four-decade highs and the resulting jump in borrowing rates, we believe that U.S. consumers and domestic-focused businesses are the likely beneficiaries of this type of regime through moderating domestic interest rates and inflationary pressures. For highly “rate-sensitive” and domestic-focused sectors including residential and commercial real estate, valuations appear particularly “cheap” if inflation and long-term interest rates have indeed peaked for the cycle as we’ve now seen a full return of the “Rates Down, REITs Up” correlations.

Hoya Capital
Hoya Capital
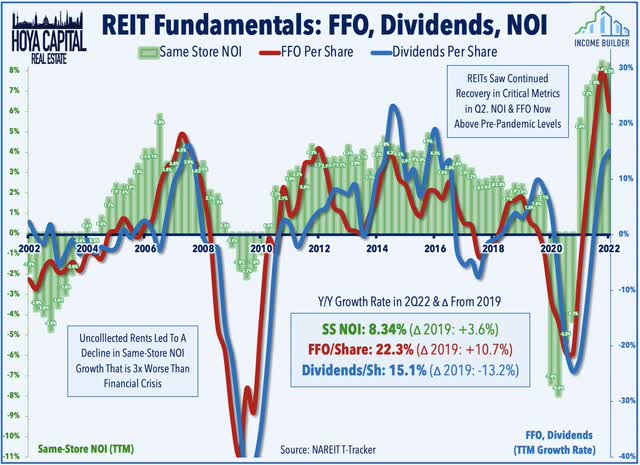
Obscured by the macro narrative, property-level fundamentals have been quite strong – and strengthening – for most property sectors in recent quarters. REIT company-level metrics have exhibited a substantial rebound since mid-2021 as REIT FFO (“Funds From Operations”) has now fully recovered the sharp declines from early in the pandemic. In the second quarter, REIT FFO was 18.9% above its 4Q19 pre-pandemic level on an absolute basis, and 10% above pre-pandemic levels on a per-share basis. Driven by an 8.3% rise in same-store Net Operating Income (“NOI”), FFO/share rose 22.3% year-over-year from 2Q21 as REITs in the more COVID-sensitive property sectors saw an added boost from the collection of unpaid rents from the prior year.
Hoya Capital
Hoya Capital
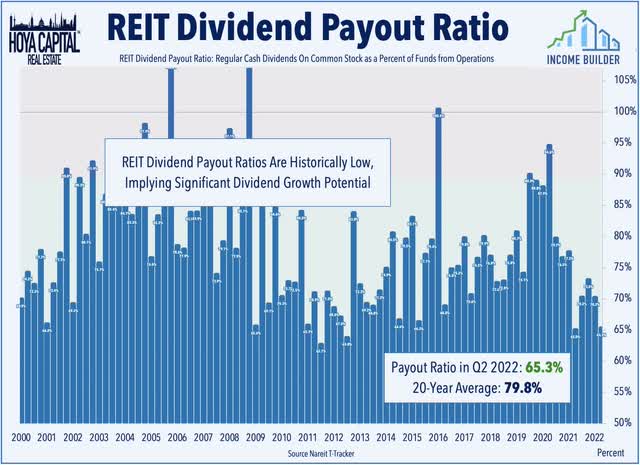
Powered by more than 130 REIT dividend hikes in 2021 and 100 so far in 2022, dividends per share rose by 15.1% from last year, but total dividend payouts remain roughly 13% below pre-pandemic levels as many REITs have been exceedingly conservative in their dividend distribution policy. With FFO growth significantly outpacing dividend growth, REIT dividend payout ratios declined to just 65.3% in Q2 – well below the 20-year average of 80%. With a historically low dividend payout ratio, we believe that REITs have significant ’embedded’ dividend growth that will be unlocked over the coming quarters – or will at least serve as a buffer to protect current payout levels if macroeconomic conditions take an unfavorable turn.
Hoya Capital
Hoya Capital
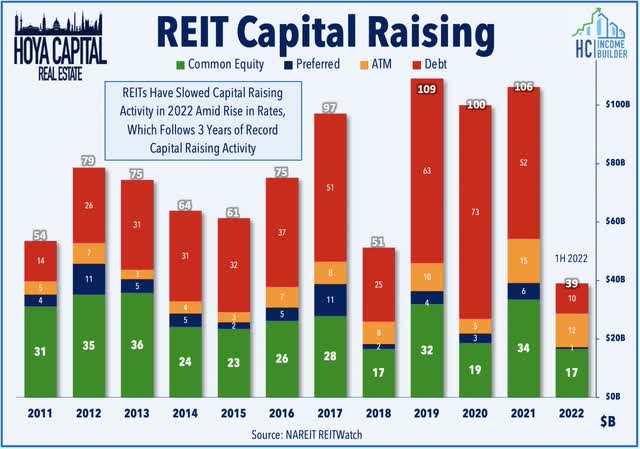
The effects of sharply higher interest rates on REITs have been far more muted than they would have been in decades past, as the industry has been exceedingly conservative with their balance sheet and strategic decisions over the past decade. REITs have been able to lean more heavily into shorter-term credit facilities for funding needs rather than tapping longer-term bond markets, hoping to “wait out” the spike in interest rates this year. REITs entered this period of volatility with a “war chest” relative to their position in 2008 as REITs raised more capital from 2019-2021 than in any prior three-year period on record with most REITs able to lock in low-interest rates on long-term debt while still maintaining a relatively “equity-rich” capital stack.
Hoya Capital
Hoya Capital
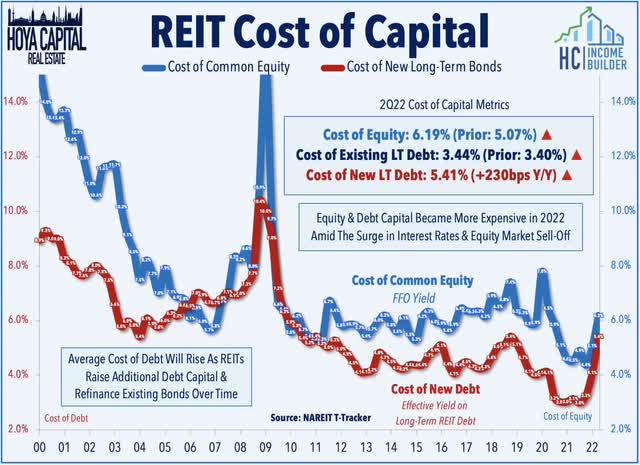
REITs had taken full advantage of lower interest rates in prior years to lower their average long-term interest rate to around 3.50% – the lowest level on record. Much like the cost of essentially all other goods and services in 2022, however, the incremental cost of capital has no doubt become far more expensive this year. The BofA BBB US Corporate Index Effective Yield – a proxy for the incremental cost of real estate debt capital – has surged from as low as 2.20% last September to as high as 5.32% at the June peak and now sit at around 4.95%. Unlike many private market players with more-limited access to long-term debt capital, the long-term nature of REIT debt has allowed most REITs to “hunker down” during this period, and in doing so, recognize very modest increases in interest expenses in the near- and medium-term.
Hoya Capital
Hoya Capital
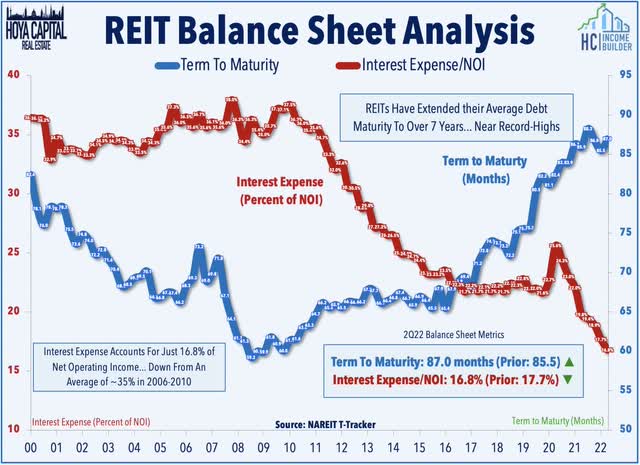
With the scars of the Great Financial Crisis still visible enough to be reminders of more dismal times, REITs have been “preparing for winter” for the last decade, perhaps to the frustration of some investors that turned to higher-leveraged and riskier alternatives in recent years. In doing so, REITs ceded some ground to private market players and non-traded REIT platforms that were willing to take on more leverage and finance operations with short-term debt. Perhaps most critically, publicly-traded REITs have far more ample access to longer-term, unsecured debt that has allowed REITs to push their average debt maturities to over 7 years – avoiding the need to refinance during unfavorable market conditions.
Hoya Capital
Hoya Capital
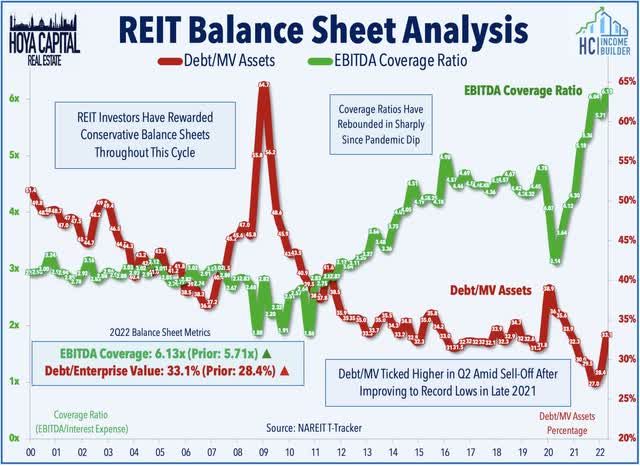
REITs entered 2022 with historically strong balance sheets across essentially every metric. Even when incorporating the recent 15% drawdown in 2022, debt as a percent of Enterprise Value still accounts for less than 35% of the REITs’ capital stack, down from an average of roughly 45% in the pre-recession period – and substantially below the 60-80% Loan-to-Value ratios that are typical in the private commercial real estate space. Meanwhile, EBITDA coverage ratios have continued to rebound to fresh record-highs after the pandemic-driven dip.
Hoya Capital
Hoya Capital
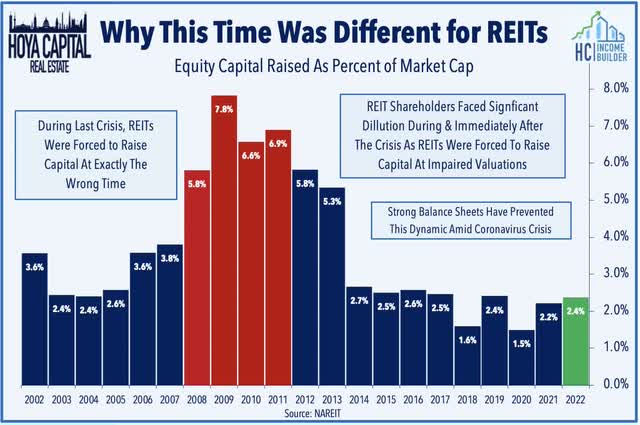
The ability to avoid “forced” capital raising events has been the cornerstone of REIT balance sheet management since the GFC – a time in which many REITs were forced to raise equity through secondary offerings at “firesale” valuations just to keep the lights on, resulting in substantial shareholder dilution which ultimately led to a “lost decade” for REITs. As we’ll discuss throughout this report, while REITs enter this period on very solid footing and deeper access to capital, the same can’t necessarily be said about many private market players that rely on more short-term borrowing and continuous equity inflows to keep the wheels spinning. Much the opposite of their role during the GFC, we believe that many well-capitalized REITs are equipped to “play offense” and take advantage of compelling acquisition opportunities if we do indeed see some degree of distress in private markets from higher rates.
Hoya Capital
Hoya Capital
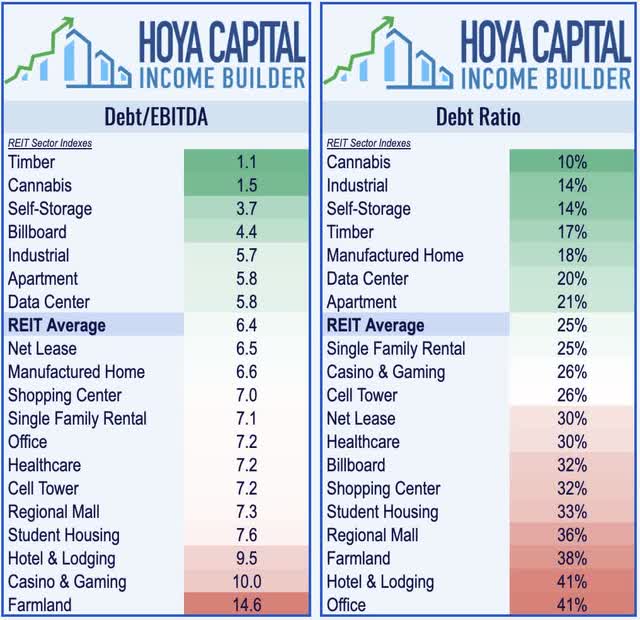
That said – not all REITs are created equal, and the broad-based sector average does mask some of the ongoing issues in several of the more at-risk sectors and among REITs that have been more aggressive in their balance sheet management. While all REIT sectors are now out of the Debt Ratio “danger-zone” above 50%, a pair of REIT sectors – hotel and office REITs – still operate with debt ratios above 40% while roughly two dozen REITs – primarily in the retail and hotel sector – operate with debt levels above 50%. On the flip side, many of the “essential” property sectors – housing, industrial, and technology – continue to operate with debt ratios below 20%.
Hoya Capital
Hoya Capital
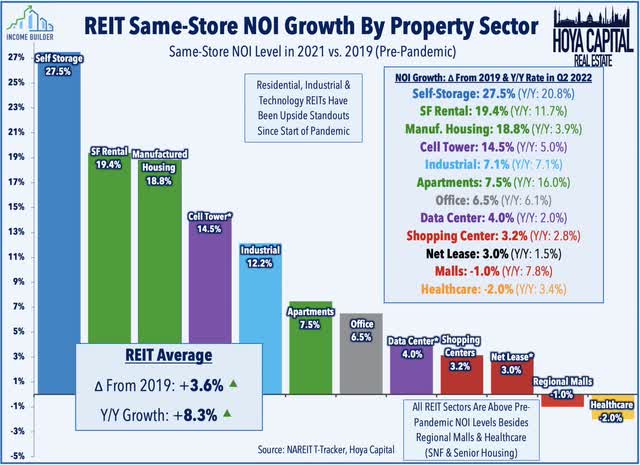
During the worst of the pandemic in 2020, REITs reported a decline in property-level metrics that dwarfed that of the prior crisis, fueled in large part by retail REITs’ difficulty in collecting rents. Driven by the normalization in rent collection across the hardest-hit sectors, same-store NOI fully recovered in early 2022 and was roughly 4% above pre-pandemic levels in the most recent quarter. The residential, industrial, and technology sectors have been the upside standouts throughout the pandemic with most REITs reporting NOI levels that were 10-30% above pre-pandemic levels. On the other hand, most shopping centers, office, and mall REITs – with some exceptions – are now roughly even with pre-pandemic property-level cash flows.
Hoya Capital
Hoya Capital
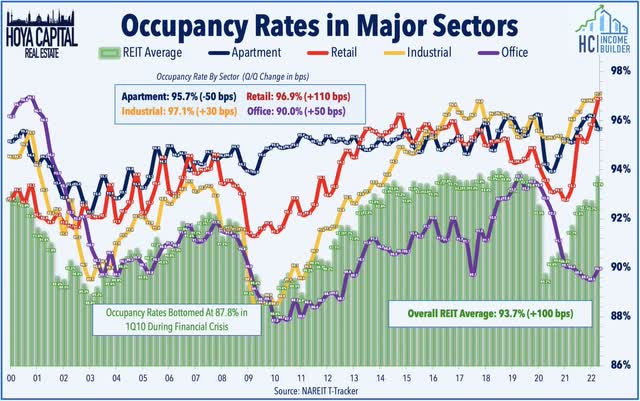
After recording the largest year-over-year decline on record in 2020 which dragged the sector-wide occupancy rate to 89.8%, REIT occupancy rates have rebounded since mid-2020 back to 93.7%. By comparison, occupancy levels dipped as low as 88% during the Financial Crisis and took three years to recover back above 90%. Apartment and industrial REITs have reported record-high occupancy rates in 2022 while retail REITs noted a solid sequential improvement. Office REIT occupancy, however, has seen substantial declines since the start of 2020 and remained 350 basis points below pre-pandemic levels at 90.0% in the second-quarter.
Hoya Capital
Hoya Capital
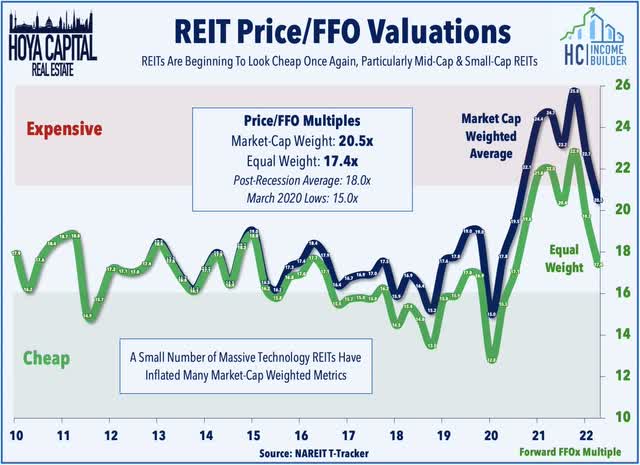
While the sell-off in early 2022 has pulled REITs back into “cheap” territory as the “Rates Up, REITs Down” paradigm has weighed on valuations, much of the sector traded at premium valuations throughout 2021 which revived the “animal spirits” and facilitated external growth opportunities that were relatively few-and-far-between over the last half-decade. Equity REITs currently trade at an average Price/FFO multiple of 20.5x using a market-cap weighted average. The market-cap-weighted average, however, is somewhat distorted by the massive weight of richly-valued technology REITs, and on an equal-weight basis, REITs trade at a 17.4x P/FFO multiple, which is once again approaching the “cheap” range based on post-GFC valuations.
Hoya Capital
Hoya Capital
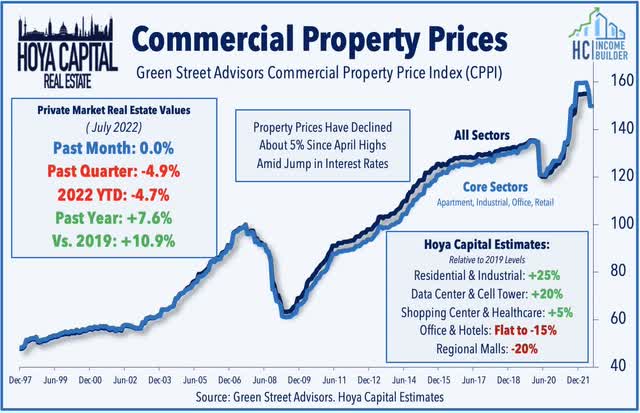
Private market real estate valuations didn’t exhibit the upside nor downside volatility of the public markets throughout the pandemic but have mirrored the overall trends seen in the REIT sector. Green Street Advisors’ data shows that private-market values of commercial real estate properties declined by roughly 15% at the lows in 2020 and rebounded into early 2022 before giving back some ground in recent months. Overall private market real estate values are now roughly 11% above their pre-pandemic levels. We estimate that office, hotels, and malls have seen a 20-25% decline in private market values due to the pandemic. Residential, industrial, shopping center, and technology real estate prices are higher by 5-25% during this time.
Hoya Capital
Hoya Capital
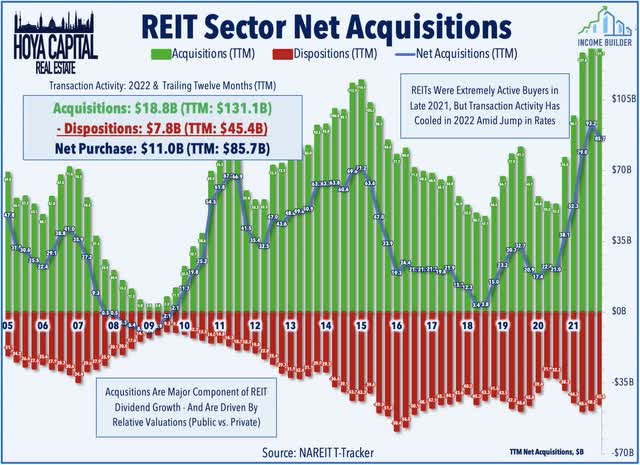
Favorable valuations in 2021 sparked a wave of external growth through M&A, IPOs, development, and property acquisitions. REITs have “pumped the breaks” amid the surge in interest rates, but we believe that opportunities should emerge over time as private players seek an exit. REIT external growth comes in two forms – buying and building. Acquisitions have historically been a key component of FFO/share growth, accounting for more than half of the REIT sector’s FFO growth over the past three decades with the balance coming from “organic” same-store growth and through development. REITs had again become active buyers in 2021, propelled by favorable valuations and ample access to capital markets, acquiring $133B in assets over the past year – the highest on record. Likely reflecting some impact from higher rates, buying activity cooled to just $18.8B in Q2 which was the lowest since Q2 2020.
Hoya Capital
Hoya Capital
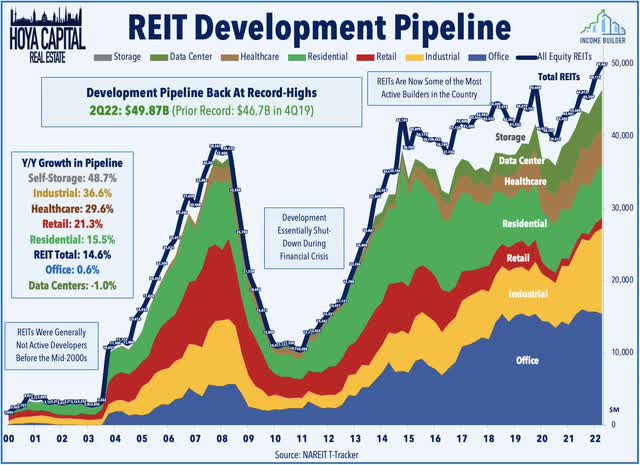
While the acquisition pipeline has cooled, REITs have continued to plow ahead with ground-up development as the total pipeline expanded in Q2 back to levels that exceeded the prior record set just before the pandemic in 4Q19 at nearly $50B. Self-storage REITs have seen their pipelines swell the most significantly – up more than 49% from last year while industrial and healthcare REITs have also been very active. New development in retail has started to rebounded modestly after very limited activity in the past half-decade while residential has also seen relatively limited supply growth despite the boom in home prices and rents over the past two years.
Hoya Capital
Hoya Capital
REIT IPOs had been relatively few-and-far-between over the past half-decade, but we did see a notable uptick in 2021 with seven public listings, the most since 2013 and we’ve seen one more REIT IPO this year with net lease REIT Modiv (MDV) listing on the NYSE. Another two REITs have recently filed for public offerings including self-storage operator SmartStop Self-Storage which filed in late April to raise up to $100 million in an initial public offering under the ticker symbol SMST. SmartStop is an internally-managed REIT that is the eleventh largest owner and operator of self storage properties in the United States. In March, Strawberry Fields filed for a $15M direct listing on the Nasdaq under ticker symbol STRW. Strawberry Fields is a healthcare REIT with a portfolio of 79 properties located primarily in the U.S. Southeast. Four recent REIT IPO filings have been either postponed or canceled including the listing for office owner Priam Properties, net lease REIT Four Springs Capital, and cannabis-focused Freehold Properties.

Hoya Capital
Hoya Capital
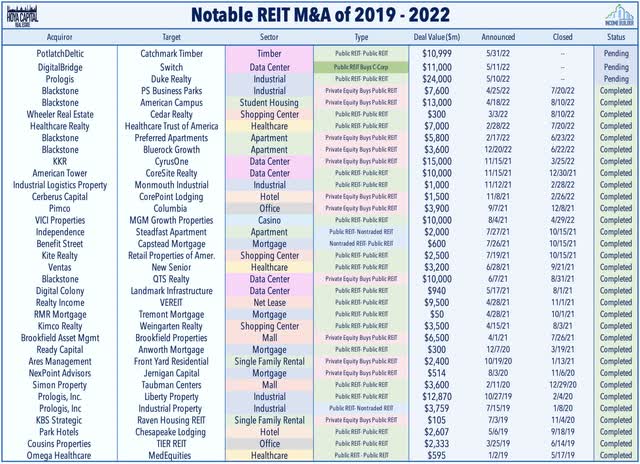
The “animal spirits” – which were very much alive in the REIT world last year – have also calmed in recent quarters following the spur of activity in early 2022. Blackstone (BX) has been quiet since April following a buying spree that included student housing REIT American Campus (ACC), industrial REIT PS Business Parks (PSB), and apartment REIT Preferred Apartment (APTS), which followed a pair of deals last year for Bluerock Residential (BRG), and QTS Realty (QTS). We’ve seen M&A in the healthcare space with the merger of two medical office REITs – Healthcare Realty (HR) and Healthcare Trust of America in March, and in the data center sector as DigitalBridge (DBRG) beat-out private equity competition to buy data center operator Switch (SWCH) – which had planned to convert to a REIT next year.
Hoya Capital
Hoya Capital
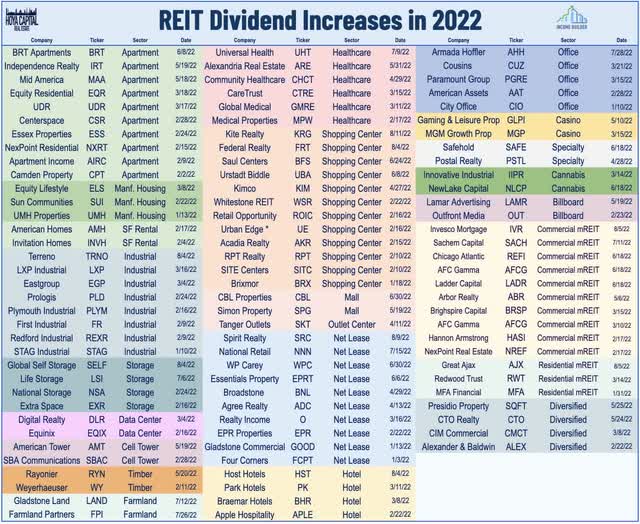
The regime of synchronized fiscal expansion and persistently elevated inflation is suddenly under siege by the deflationary effects of deteriorating economic conditions in Europe and Asia – potentially the start of a new economic regime that would likely be more favorable to domestic-focused rate-sensitive industry groups including residential and commercial real estate. Due to conservative balance sheet management over the past decade, REITs have been able to “hunker down” during this period of rising rates – avoiding the type of dilutive and high-cost capital raises that were necessary during the Financial Crisis. Obscured by the macro narrative, REIT property-level fundamentals have been quite strong – and strengthening – in recent quarters. 100 REITs have now hiked their dividend this year. With a historically low dividend payout ratio, REITs have significant ’embedded’ dividend growth that will be unlocked over the coming quarters – or will at least serve as a buffer to protect current payout levels if macroeconomic conditions take a turn for the worse.
Hoya Capital
Hoya Capital
For an in-depth analysis of all real estate sectors, be sure to check out all of our quarterly reports: Apartments, Homebuilders, Manufactured Housing, Student Housing, Single-Family Rentals, Cell Towers, Casinos, Industrial, Data Center, Malls, Healthcare, Net Lease, Shopping Centers, Hotels, Billboards, Office, Farmland, Storage, Timber, Mortgage, and Cannabis.
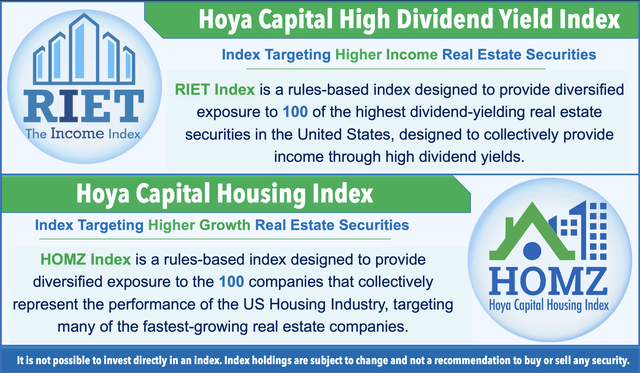
Disclosure: Hoya Capital Real Estate advises two Exchange-Traded Funds listed on the NYSE. In addition to any long positions listed below, Hoya Capital is long all components in the Hoya Capital Housing 100 Index and in the Hoya Capital High Dividend Yield Index. Index definitions and a complete list of holdings are available on our website.
Hoya Capital
Hoya Capital
Amid the historic market volatility – and persistent inflation – our focus at Income Builder is on real income-producing asset classes that offer the opportunity for reliable income, diversification, and inflation hedging. Get started today with a Free Two-Week Trial and you can take a look at our top ideas – including our new Landowner Portfolio – and see what we’re investing in to help build sustainable portfolio income.
Subscribers gain complete access to our investment research and our suite of trackers and income-focused portfolios targeting premium dividend yields up to 10% across real income-producing asset classes. 
This article was written by
Visit www.HoyaCapital.com for more information and important disclosures. Hoya Capital Research is an affiliate of Hoya Capital Real Estate (“Hoya Capital”), a research-focused Registered Investment Advisor headquartered in Rowayton, Connecticut.
Founded with a mission to make real estate more accessible to all investors, Hoya Capital specializes in managing institutional and individual portfolios of publicly traded real estate securities, focused on delivering sustainable income, diversification, and attractive total returns.
Hoya Capital Real Estate (“Hoya Capital”) is a registered investment advisory firm based in Rowayton, Connecticut that provides investment advisory services to ETFs, individuals, and institutions. Hoya Capital Research & Index Innovations is an affiliate that provides non-advisory services including research and index administration focused on publicly traded securities in the real estate industry.
This published commentary is for informational and educational purposes only. Nothing on this site nor any commentary published by Hoya Capital is intended to be investment, tax, or legal advice or an offer to buy or sell securities. This commentary is impersonal and should not be considered a recommendation that any particular security, portfolio of securities, or investment strategy is suitable for any specific individual, nor should it be viewed as a solicitation or offer for any advisory service offered by Hoya Capital. Please consult with your investment, tax, or legal adviser regarding your individual circumstances before investing.
The views and opinions in all published commentary are as of the date of publication and are subject to change without notice. Information presented is believed to be factual and up-to-date, but we do not guarantee its accuracy and it should not be regarded as a complete analysis of the subjects discussed. Any market data quoted represents past performance, which is no guarantee of future results. There is no guarantee that any historical trend illustrated herein will be repeated in the future, and there is no way to predict precisely when such a trend will begin. There is no guarantee that any outlook made in this commentary will be realized.
Readers should understand that investing involves risk and loss of principal is possible. Investments in real estate companies and/or housing industry companies involve unique risks, as do investments in ETFs. The information presented does not reflect the performance of any fund or other account managed or serviced by Hoya Capital. An investor cannot invest directly in an index and index performance does not reflect the deduction of any fees, expenses or taxes.
Hoya Capital has no business relationship with any company discussed or mentioned and never receives compensation from any company discussed or mentioned. Hoya Capital, its affiliates, and/or its clients and/or its employees may hold positions in securities or funds discussed on this website and our published commentary. A complete list of holdings and additional important disclosures is available at www.HoyaCapital.com.
Disclosure: I/we have a beneficial long position in the shares of RIET, HOMZ, STOR, NLY, AGNC, SRC, BXMT, UBA, GTY, MGP, ACC, NNN, STWD, HIW, CCI, SPG, SBRA, DOC, ILPT, SUI, INVH, AMT, REG, DRE, CUBE, IIPR, ARE, FR, CPT, EQIX, APLE, MAA, PCH, PLD, DLR, LAMR, MDC, KRG, STAG, GLPI , NRZ, ABR, UMH, GMRE either through stock ownership, options, or other derivatives. I wrote this article myself, and it expresses my own opinions. I am not receiving compensation for it (other than from Seeking Alpha). I have no business relationship with any company whose stock is mentioned in this article.
Additional disclosure: Hoya Capital Research & Index Innovations (“Hoya Capital”) is an affiliate of Hoya Capital Real Estate, a registered investment advisory firm based in Rowayton, Connecticut that provides investment advisory services to ETFs, individuals, and institutions. Hoya Capital Research & Index Innovations provides non-advisory services including market commentary, research, and index administration focused on publicly traded securities in the real estate industry.
This published commentary is for informational and educational purposes only. Nothing on this site nor any commentary published by Hoya Capital is intended to be investment, tax, or legal advice or an offer to buy or sell securities. This commentary is impersonal and should not be considered a recommendation that any particular security, portfolio of securities, or investment strategy is suitable for any specific individual, nor should it be viewed as a solicitation or offer for any advisory service offered by Hoya Capital Real Estate. Please consult with your investment, tax, or legal adviser regarding your individual circumstances before investing.
The views and opinions in all published commentary are as of the date of publication and are subject to change without notice. Information presented is believed to be factual and up-to-date, but we do not guarantee its accuracy and it should not be regarded as a complete analysis of the subjects discussed. Any market data quoted represents past performance, which is no guarantee of future results. There is no guarantee that any historical trend illustrated herein will be repeated in the future, and there is no way to predict precisely when such a trend will begin. There is no guarantee that any outlook made in this commentary will be realized.
Readers should understand that investing involves risk and loss of principal is possible. Investments in real estate companies and/or housing industry companies involve unique risks, as do investments in ETFs. The information presented does not reflect the performance of any fund or other account managed or serviced by Hoya Capital Real Estate. An investor cannot invest directly in an index and index performance does not reflect the deduction of any fees, expenses or taxes.
Hoya Capital Real Estate and Hoya Capital Research & Index Innovations have no business relationship with any company discussed or mentioned and never receives compensation from any company discussed or mentioned. Hoya Capital Real Estate, its affiliates, and/or its clients and/or its employees may hold positions in securities or funds discussed on this website and our published commentary. A complete list of holdings and additional important disclosures is available at www.HoyaCapital.com.


