
sefa ozel
sefa ozel
I love investing in income-producing assets such as Business Development Corporations (BDC), Master Limited Partnerships (MLP), and Real Estate Investment Trusts (REITs). I have increased exposure to REITs because they allow me to invest in real estate without managing properties or dealing with tenants. For all the success stories I hear about in the real estate sector, I rarely hear about the headaches and failures. I don’t have the time to dedicate to owning physical real estate as income-producing assets, and I don’t subscribe to the notion that they are set it and forget assets. When I invest in REITs, I get exposure to real estate while collecting my dividends and going about the day. Recently, someone I discuss investments with frequently asked me why the Vanguard Real Estate ETF (NYSEARCA:VNQ) is in my portfolio? I was asked two questions, why do I like picking individual REITs for my main account, and for the Dividend Harvesting Series that I write on Seeking Alpha, how come VNQ isn’t part of the ETF section? I love Vanguard, and I am invested in several of their ETFs, but I am not a fan of VNQ as its an ETF made up of 168 equity-based REITs with a dividend yield of 3.02% ($2.86/$94.79). I would rather select a handful of REITs that meet my investment criteria and generate around a 5-6% yield. I don’t see the point in investing in a REIT ETF if it’s going to produce the same yield as a high dividend ETF such as Vanguard’s High Dividend Yield ETF (VYM), which has a 3.06% yield or the Schwab U.S Dividend Equity ETF (SCHD) which yields 3.33%.
VNQ tracks the MSCI US Investable Market Real Estate 25/50 Index and invests in small, medium, and large-cap companies across the U.S equity real estate market. The 25/50 index has 12 subcategories it invests in, including specialized, residential, industrial, retail, healthcare, office, diversified, and hotel & resort REITs, in addition to real estate services, operating companies, and other. VNQ employs an indexing approach to track the MSCI US Investable Market Real Estate 25/50 Index. VNQ attempts to track the Index by investing virtually all its assets. Vanguard charges a low expense ratio of 0.12% compared to an industry average expense ratio of 1.08% for similar funds.
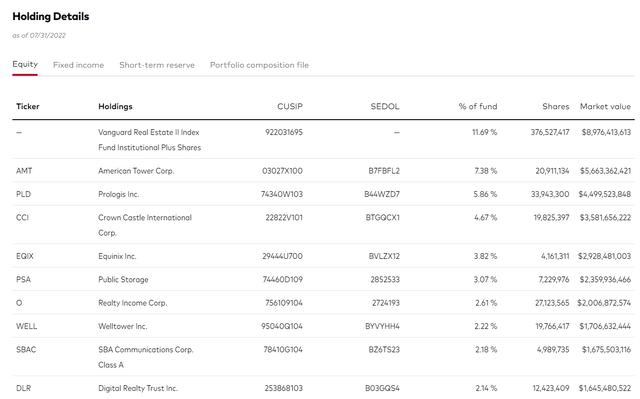
There are currently 168 holdings with a median market cap of $26.9 billion within VNQ. VNQ’s total net assets equal $76.7 billion. Its top ten holdings consist of:
VNQ’s top ten holdings account for 45.64% of its total net assets.

Vanguard
Vanguard
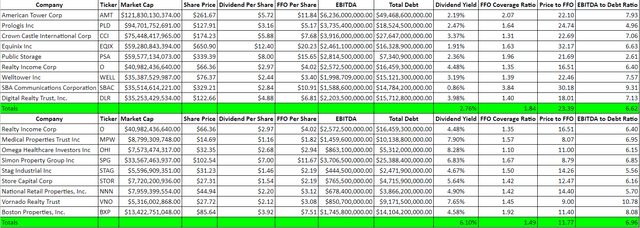
When I recreated VNQ’s top ten holdings the way I look at REITs, first I extracted the Vanguard real estate index since it didn’t have a ticker symbol, and I charted everything out so I could look at each individual company’s dividend, Funds From Operations (FFO), EBITDA, and Total Debt. I am also looking at these companies as an aggregate and the combined average dividend yield, FFO coverage ratio, price to FFO, and EBITDA to Total Debt ratio. Without the Vanguard Real Estate index, these 9 companies make up 33.95% of the portfolio, and their average dividend yield is 2.76%.

Steven Fiorillo, Seeking Alpha
Steven Fiorillo, Seeking Alpha
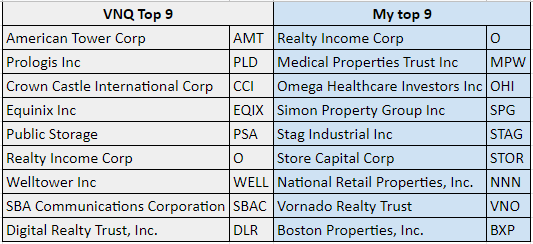
I love equity REITs as it allows me to have an equity stake in physical real estate, not have to deal with the headaches, and get paid dividends. The equity REITs I am currently invested in are:

Steven Fiorillo, Seeking Alpha
Steven Fiorillo, Seeking Alpha
When I look at REITs there are 4 main metrics that I look at. These include the share price to Funds From Operations (FFO), the EBITDA to Total Debt ratio, dividend yield, and the FFO coverage ratio on the dividend. Funds from operations or FFO represent the actual cash generated from the REIT’s operation. It is a widely used ratio for valuation purposes as it has become the primary earning metric in REITs. FFO = Net Income + Depreciation and Amortization + Loss on Sales of Asset – Gain on Sales of Assets + Interest Income. When it comes to REITs, you want to see the FFO coverage ratio rather than going by the EPS.
The top 9 holdings from VNQ had an average dividend yield of 2.76% with an FFO coverage ratio of 1.84x. Their average price to FFO ratio was 23.39x, and EBITDA to total debt ratio was 6.62x. The only overlap between my equity REITs and VNQ’s top holdings is O. VNQ’s top 9 individual REITs may be great companies but having a 2.76% dividend yield is just too small for me.
The 6 equity REITs that I own have a combined average yield of 6.18%, with an FFO coverage ratio of 1.43x. While the dividend yield is roughly 250% larger, the FFO coverage ratio between them is 1.43x which leaves a lot of room for both margin of safety, and future dividend increases. The average price per FFO is also 12.17x on my 6 REITs which is almost half what the top 9 REITs in VNQ have. This indicates that I am paying a much better price for the REITs that I am investing in. The EBITDA to Total Debt ratios are roughly the same.
When I look at VNQ’s overall yield, then the metrics behind its top 9 individual REITs, I just can’t get excited. I don’t think VNQ is a bad investment, but I do think you can recreate arguably a more enticing version of its top 9 positions.
If I was going to add 3 additional equity REITs to my current 6, I would add STORE Capital (STOR), Vornado Realty Trust (VNO), and Boston Properties Inc (BXP).

Steven Fiorillo
Steven Fiorillo
By adding STOR, VNO, and BXP my average dividend yield would decrease to 6.1% from 6.18%, while the FFO coverage ratio increased from 1.43x to 1.49x. The average price to FFO across the 9 companies declined to 11.77 from 12.17, but the EBITDA to Total Debt ratio increased from 6.27x to 6.96x.
Instead of investing in VNQ, which is a top-heavy ETF, I would rather invest in these 9 equity REITs I selected. The dividend yield is 6.10%, and you get a good mix of commercial real estate. Through the mixture, I created your gaining exposure to hospitals, senior and assisted living, Malls, industrial space, office buildings, and commercial shopping centers. The tenants across these properties include Amazon (AMZN), Target (TGT), Home Depot (HD), Walmart (WMT), and many other of the largest companies in the world.

Steven Fiorillo, Seeking Alpha
Steven Fiorillo, Seeking Alpha
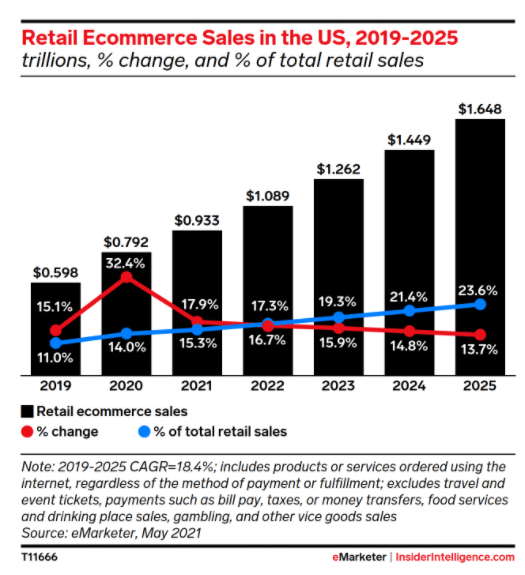
Some investors would say that I am too focused on physical retail and that VNQ offers a wide diversification range, including cell towers, data centers, and storage. There is no question that VNQ offers a larger range of diversification, but traditional retail isn’t going away. According to Insider Intelligence, the e-commerce sector in the U.S is expected to crack the $1 trillion mark for the first time in 2022, ending the year with $1.09 trillion in sales. Interestingly enough, this is only 17.3% of the projected retail sales in 2022. By the end of 2025, e-commerce in the U.S is expected to increase to $1.65 trillion in sales, which will still only account for 23.6% of retail sales in the U.S. I think having a wide range of commercial real estate through several REITs is fine and I won’t be interested in cell towers and data centers unless the yields significantly increase.

Insider Intelligence
Insider Intelligence
If you own VNQ, I would just hold it. VNQ is a perfectly good REIT, its well-diversified and generates an adequate yield. If you don’t own VNQ and want exposure to REITs I think you can recreate VNQ’s top holdings to build out a diversified commercial real estate mini-ETF that generates more than 2x the yield. I can’t see myself adding VNQ to my ETF investments until its yield gets closer to 5-6%. VNQ has a spot on my watchlist, and I periodically check to see what the yield looks like, but it’s just not for me at this point. I can build out a somewhat diversified commercial real estate mini-REIT, become the landlord to America’s largest companies, and generate over 6% in dividend yield just by selecting several REITs.
Barbell Capital provides investors with a comprehensive approach that utilizes growth, value, dividends, and options for income, to generate alpha in your portfolio while mitigating downside risk. Within Barbell Capital you will find exclusive research, model portfolios, investment tools, Q&A sessions, watchlists, and additional features for its members. There is also a live portfolio dedicated to generating capital from trading, selling puts, and selling covered calls. The profits will be allocated to future capital appreciating investments and investing in dividend investments to generate income while we sleep. Join today with a two week free trial!
This article was written by
I am focused on growth and dividend income. My personal strategy revolves around setting myself up for an easy retirement by creating a portfolio which focuses on compounding dividend income and growth. Dividends are an intricate part of my strategy as I have structured my portfolio to have monthly dividend income which grows through dividend reinvestment and yearly increases. Feel free to reach out to me on Seeking Alpha or https://dividendincomestreams.substack.com/
Disclosure: I/we have a beneficial long position in the shares of O, OHI, MPW, SPG, NNN, STAG, SCHD, VYM, AMZN either through stock ownership, options, or other derivatives. I wrote this article myself, and it expresses my own opinions. I am not receiving compensation for it (other than from Seeking Alpha). I have no business relationship with any company whose stock is mentioned in this article.
Additional disclosure: Disclaimer: I am not an investment advisor or professional. This article is my own personal opinion and is not meant to be a recommendation of the purchase or sale of stock. Investors should conduct their own research before investing to see if the companies discussed in this article fit into their portfolio parameters.


