

Funtap
Funtap
For readers wanting an introduction on REITs, please see this article here.
This year, the volatile market environment is forcing investors to re-consider how to position their portfolios as inflation continues to put its stamp on the economy.
Real estate assets are popping up on investors’ radars recently given the strength of these underlying markets and their ability to pass through rising input costs to tenants.
Real estate investment trusts (REITs) are one potential solution for income investors that may be attractive in higher rate environments like the one we’re seeing today.
REITs traditionally offer above the S&P 500 yield because of the nature of the businesses and cash flows received. Maybe even more importantly, REITs can also be a hedge against inflation, which has turned into a major storyline in the economy today and one that investors are struggling to grapple with. Similar to broad equities, certain REITs sectors offer more growth or value tilts than others, and their performance has varied dramatically over the past few years.
In this piece, we explore why REITs should be evaluated today, and how investors can use either a broad basket of REITs or certain segments of REITs for pursuing their income needs.
REITs earn income from rentals on property, but the nature of rental income can vary by specific company/ property or REIT sub-sector, such as: length of contract, rental amount basis; fixed dollar amount or percentage of sales component, and whether the contract includes a specific inflation adjustment clause.
A short duration contract, such as hotels which set a nightly rate, allows prices to be adjusted very quickly in response to market pricing or inflation. Conversely long-term lease agreements may contain rental escalation clauses, where the rental amount is increased periodically with inflation and so provide explicit inflation protection.
On the expense side of REITs contracts, rental agreements can range from various net leases to gross leases. A gross lease essentially means the tenant pays one bill, and from this the building owner pays the various operating costs (taxes, insurance, utilities, maintenance).
In an inflationary environment a gross lease may leave the building owner exposed to rising costs which could impact their margins. Interest costs are also a major expense for REITs, but with about 80% of REITs debt on fixed rates, REITs are less immediately exposed to rising interest costs.¹
REITs have grown in recent decades to become a major component of listed markets. U.S. listed REITs have a market capitalization of over $1.6 trillion, and own assets worth over $2.5 trillion (as of Q1 2022).²
The total commercial property market (listed and unlisted) has been estimated at $20 trillion, with approximately 9% of the market owned by listed REITs which is a large increase on the 1% ownership in the mid-1990’s.³
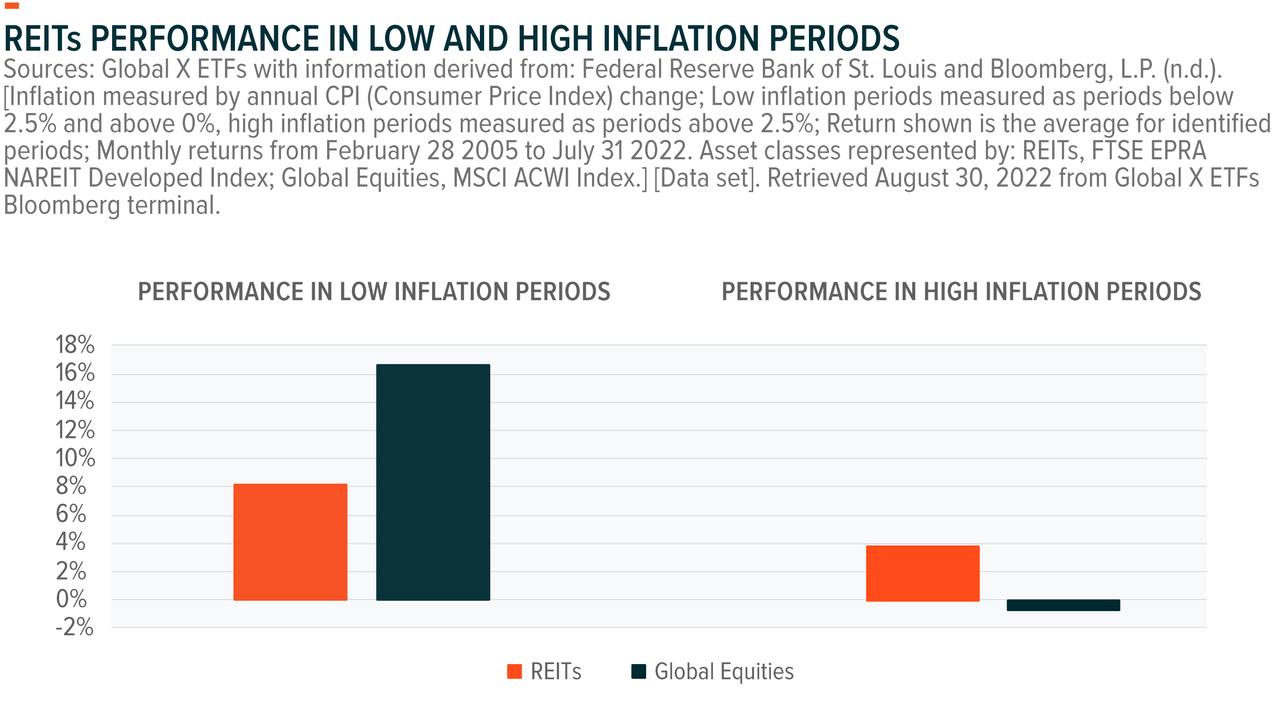
Historically when U.S. inflation is high, REITs have tended to outperform global equities, while underperforming in periods of low inflation as illustrated in the chart below.
The US Federal Reserve (Fed) targets an average inflation rate of around 2%, with sustained periods of inflation above or below this likely to require Fed intervention.⁴ Therefore, we have defined low inflation as periods when US consumer price inflation is above 0% but below 2.5% and high inflation as periods when it is above 2.5%.
Real estate can be a good inflation hedge due to the structure of rental contracts as discussed earlier. In addition, the replacement cost of constructing a property can rise due to inflation in the cost of materials and labor. This should result in the price of properties being supported by inflation.
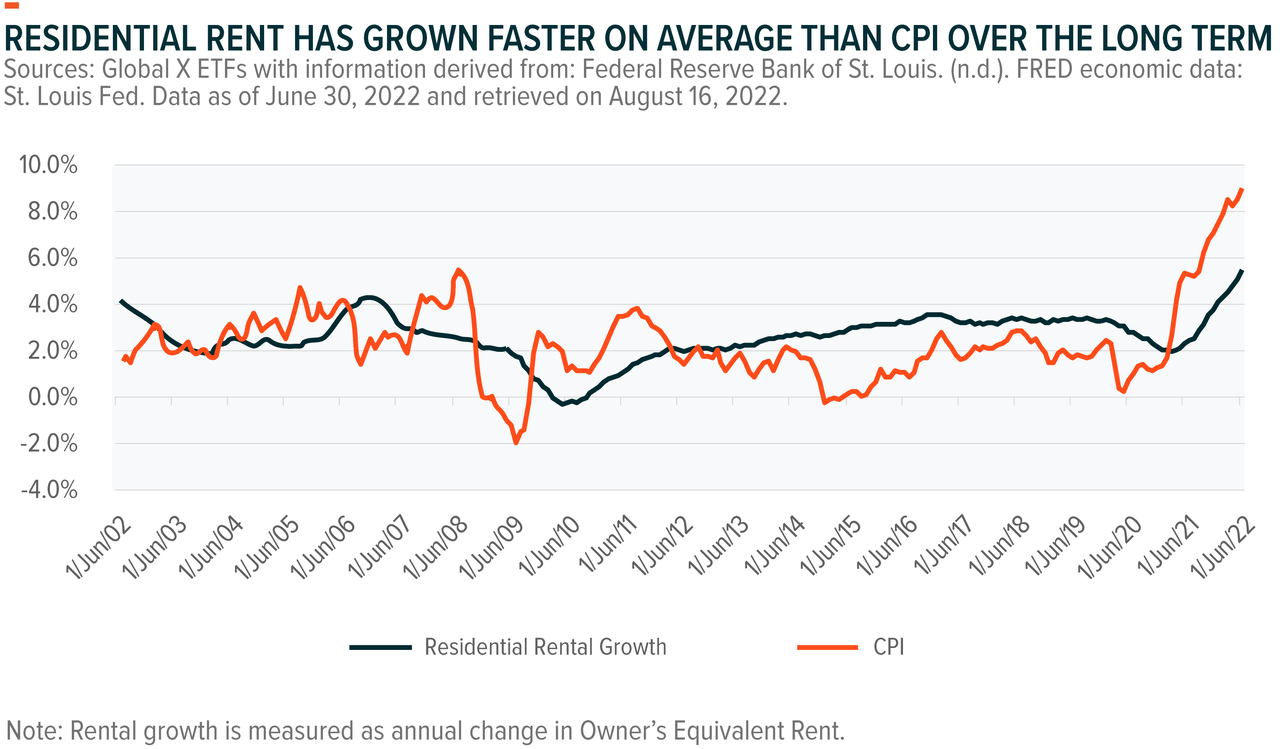
Inflation is typically measured as consumer price inflation (CPI) and measures the annualized inflation in price of a basket of goods in the U.S.. This basket of goods includes rent related components under ‘shelter’, which comprises 32.8% weight of the CPI.⁵
Essentially property rental, particularly residential, can be considered a good inflation hedge as it is a major component of what we term inflation. The main rent component of shelter in CPI, owners equivalent rent, has averaged 2.6% per year over the last 20 years, compared to 2.3% for US CPI. Residential REITs make up 15.5% of the global REITs index.⁶
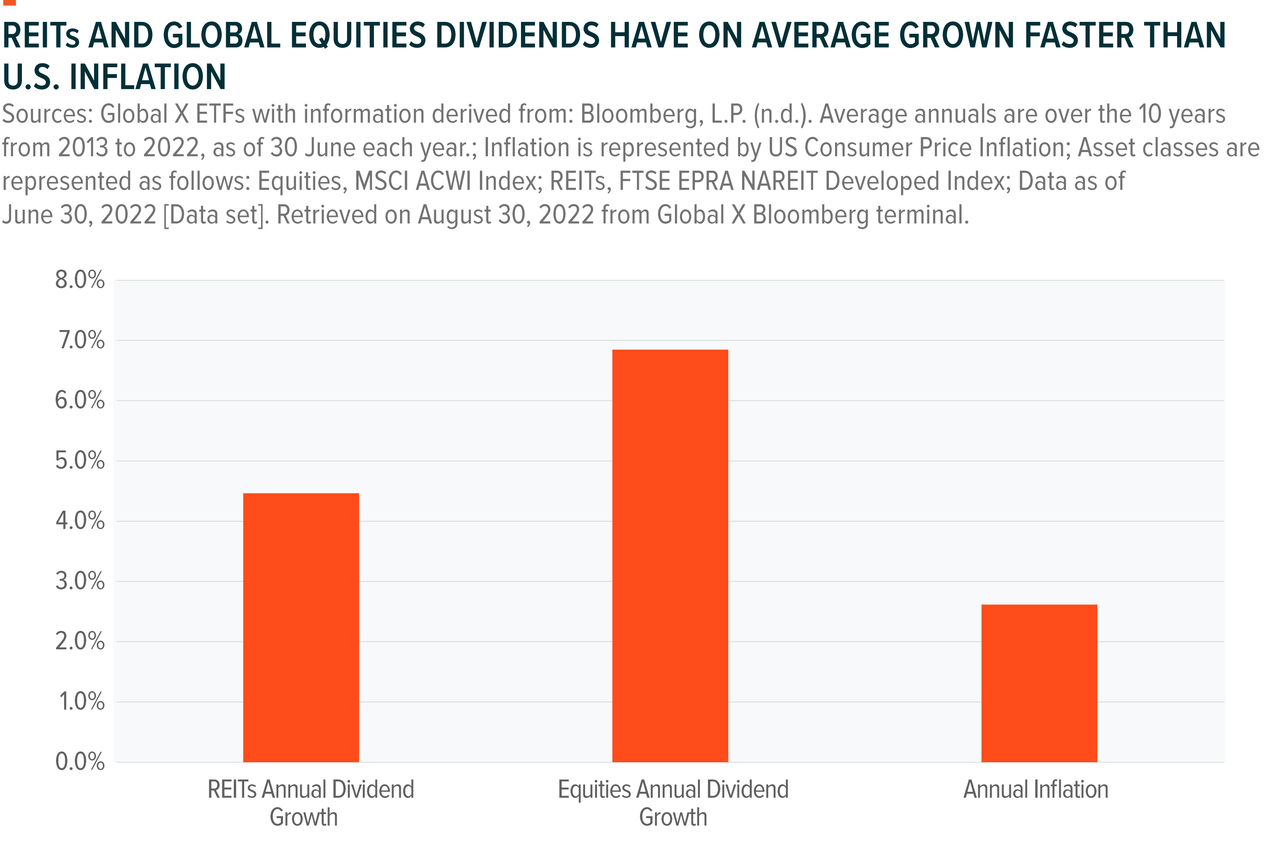
REITs have tended to offer higher dividend yields than global equities, and grow their dividends faster than inflation on average. For investors the ability for income to keep up with inflation is important for considering spending power. The chart below shows REITs’ dividend growth has averaged 4.5% over the last 10 years, beating the annual inflation average of 2.8% during this period.
REITs can be attractive dividend payers for these fundamental reasons:
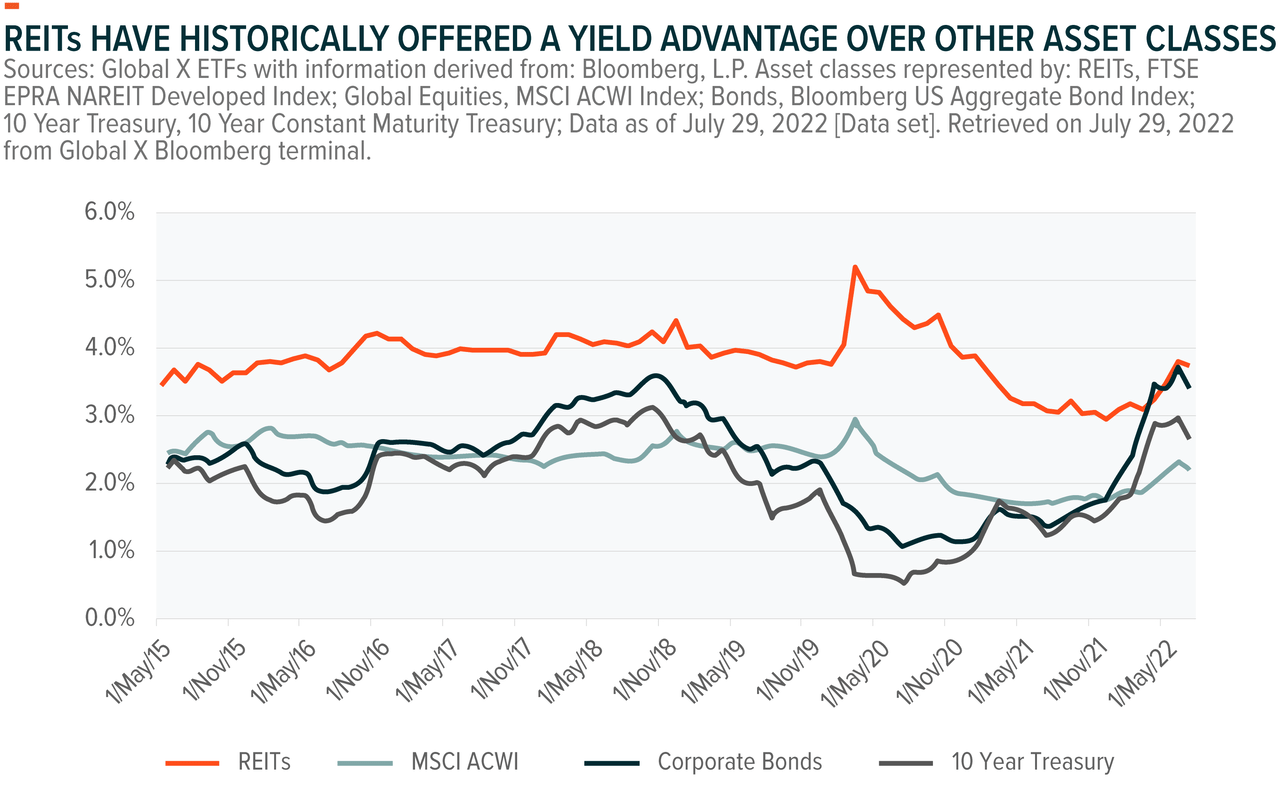
The chart below shows that REITs historically have offered a yield pick-up over many other traditional asset classes. Most recently, the spread between REITs’ dividend yields and fixed income yields has narrowed with interest rates rising. In our view, there is room for REITs to grow their earnings and dividends given the higher inflation backdrop.
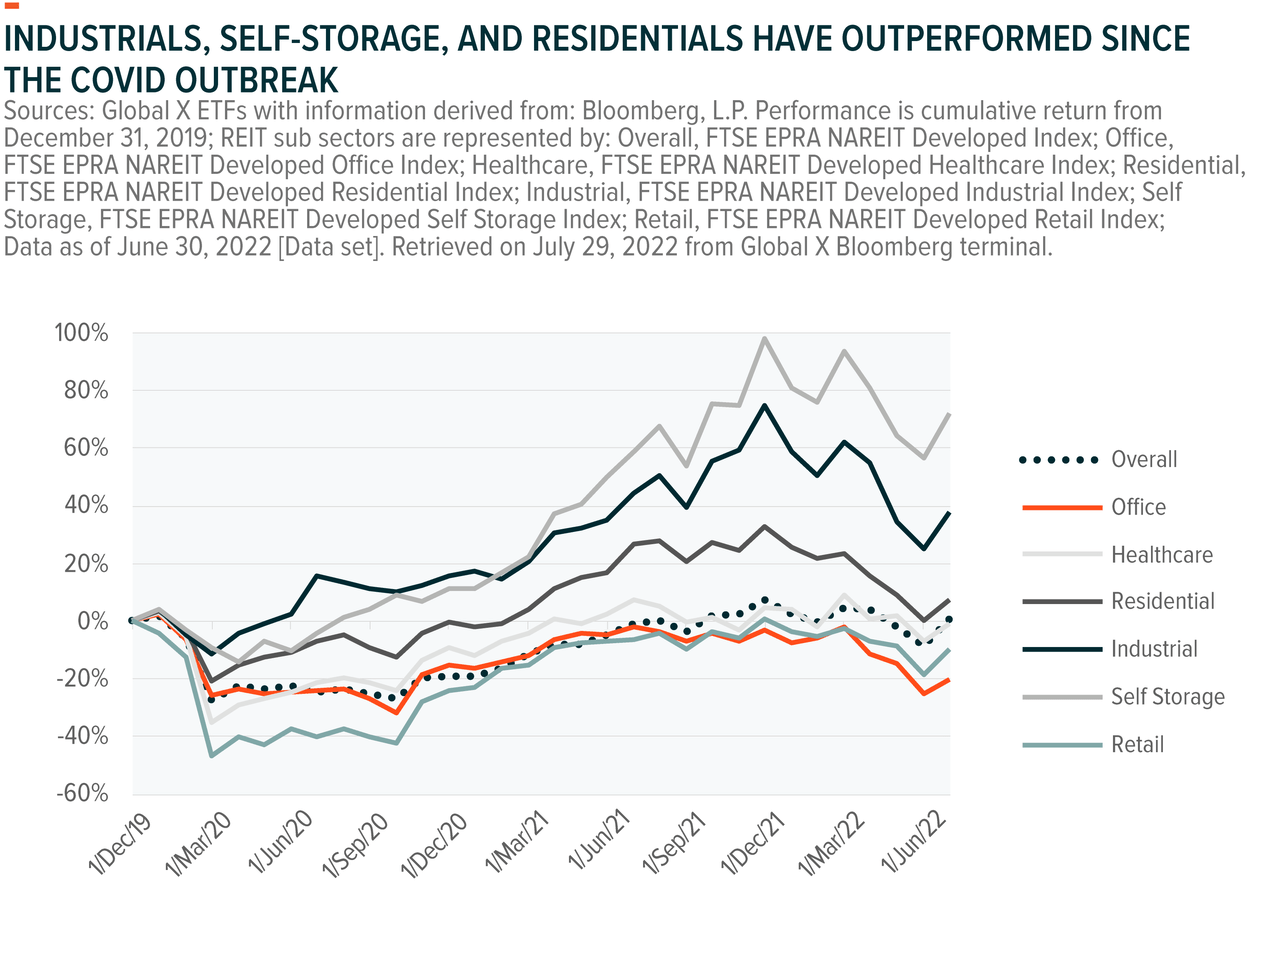
Within REITs sub-sectors, there has been a high degree of variance in performance pre- and post-COVID-19. The chart below shows how industrials, self-storage, and residentials outperformed following the beginning of the COVID-19 outbreak due to shifts in consumer behavior.
More recently, the lower-yielding sectors have underperformed as they tend to be the more expensive REITS and have been impacted by rising rates in 2022 more than other sub sectors. As interest rates rise, this can be negative for real estate values as commercial real estate is often valued using discounted cashflow or capitalization rate (cap rate) measures, which incorporate a discount rate for valuation.
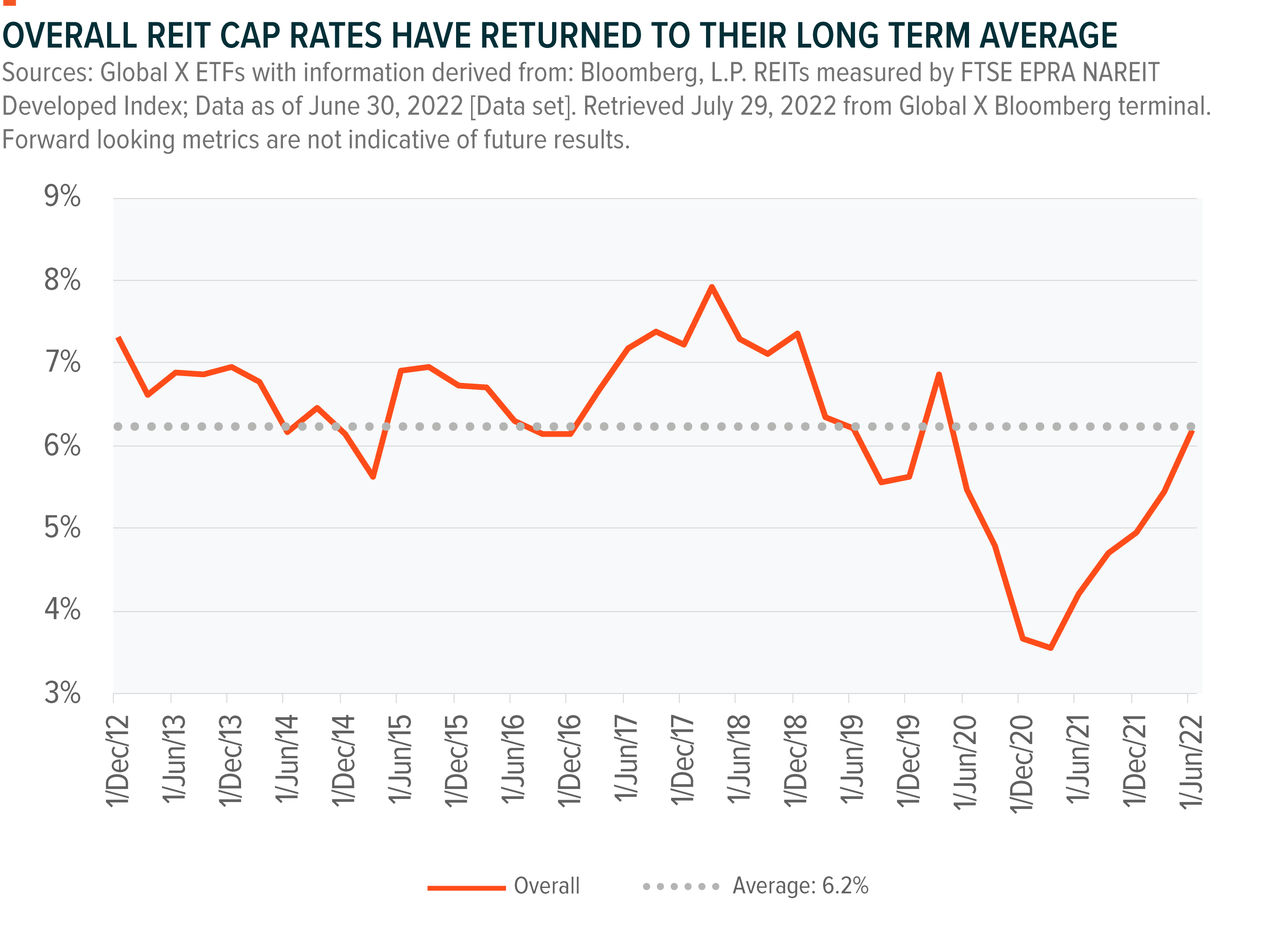
The cap rate is used in real estate as a valuation or expected return metric. We can use cap rates to view the relative valuations of REITs by sector, country, or over time. The below chart shows the overall REITs historic cap rate, and we can see that as REITs have fallen in value in 2022 they have returned to their longer term average.
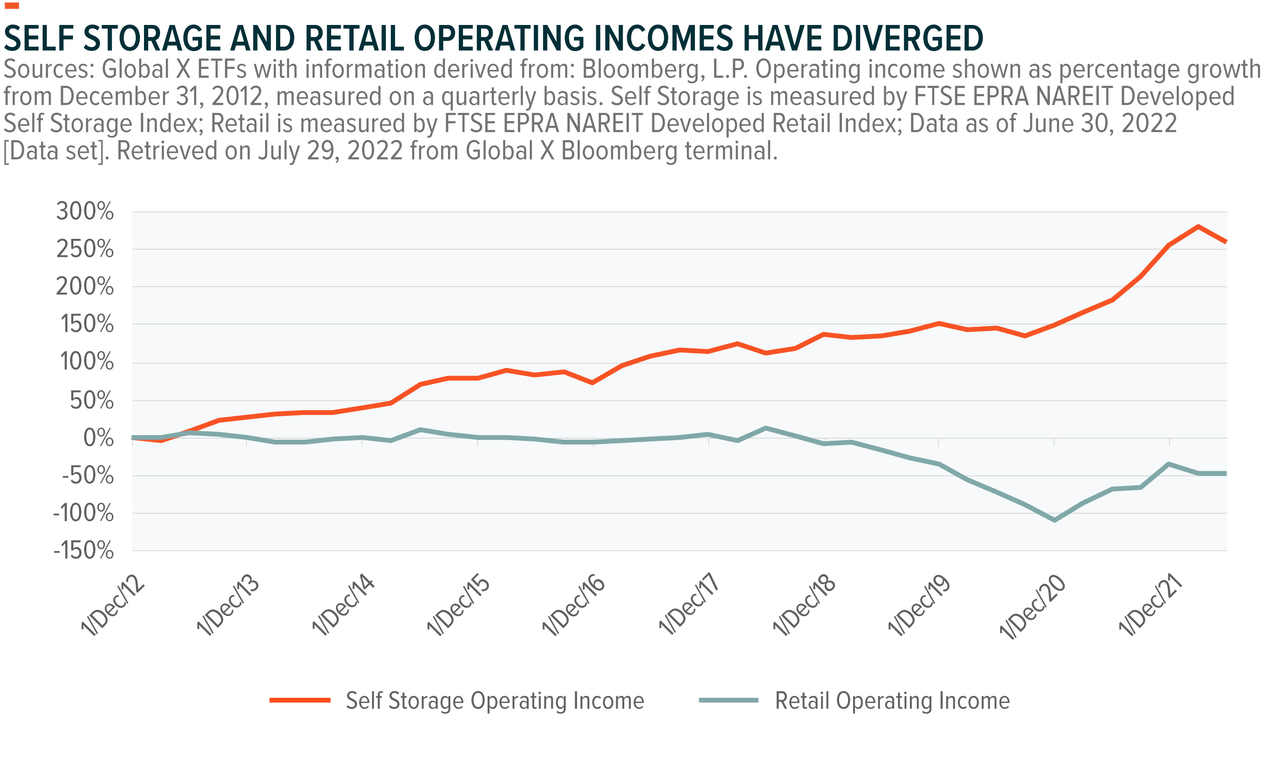
Cap rates reflect both income and market price, and some sectors like retail and office have seen income fall due to structural trends such as e-commerce increasing share over in-store commerce, as well as impacts from COVID-19 and the subsequent changes in consumer behavior.
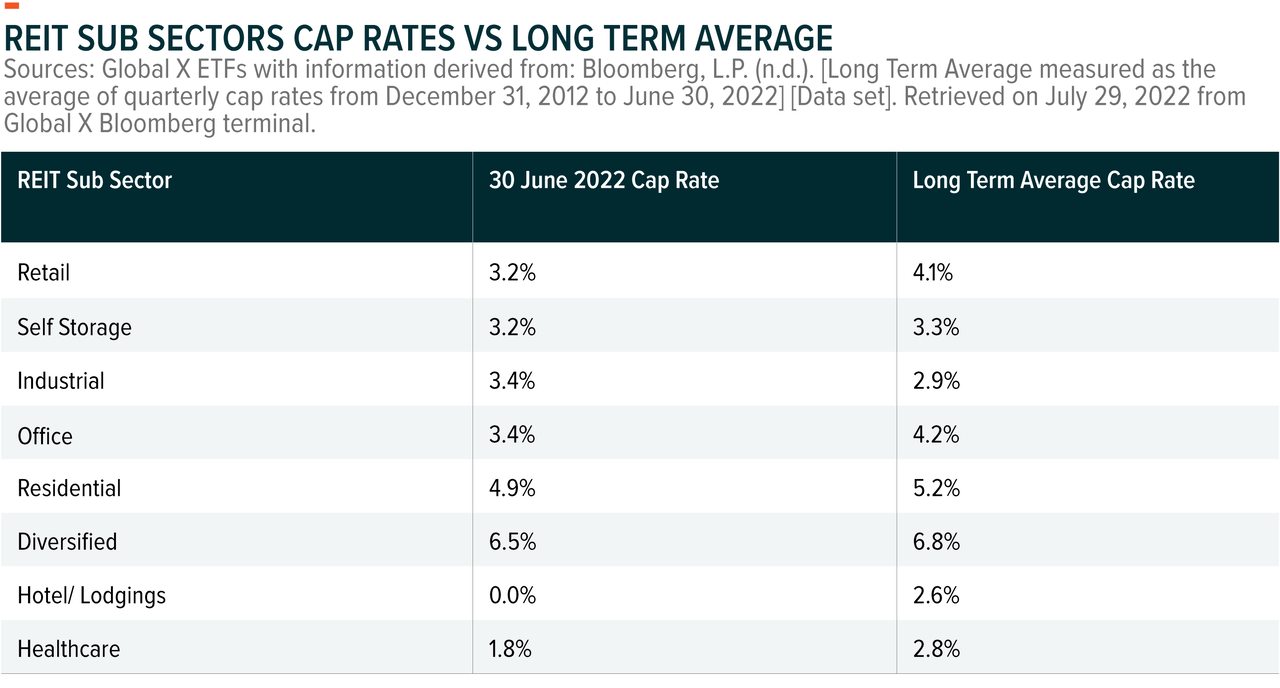
Investors should therefore consider income prospects of REIT sub sectors, as well as the valuation implied by cap rates. The table below compares cap rates at the sub sector level compared to their long-term average.
The divergence in REITs sector performance also illustrates that, while diversification does not ensure a profit or guarantee against a loss, it is importance to consider investing in a diversified portfolio of REITs.
In addition to sub-sector diversification, REIT investors can also seek geographic diversification to seek potential higher yields and differing exposures. Developed REIT markets outside the U.S. are located across Japan, the UK, Hong Kong, Australia and others.
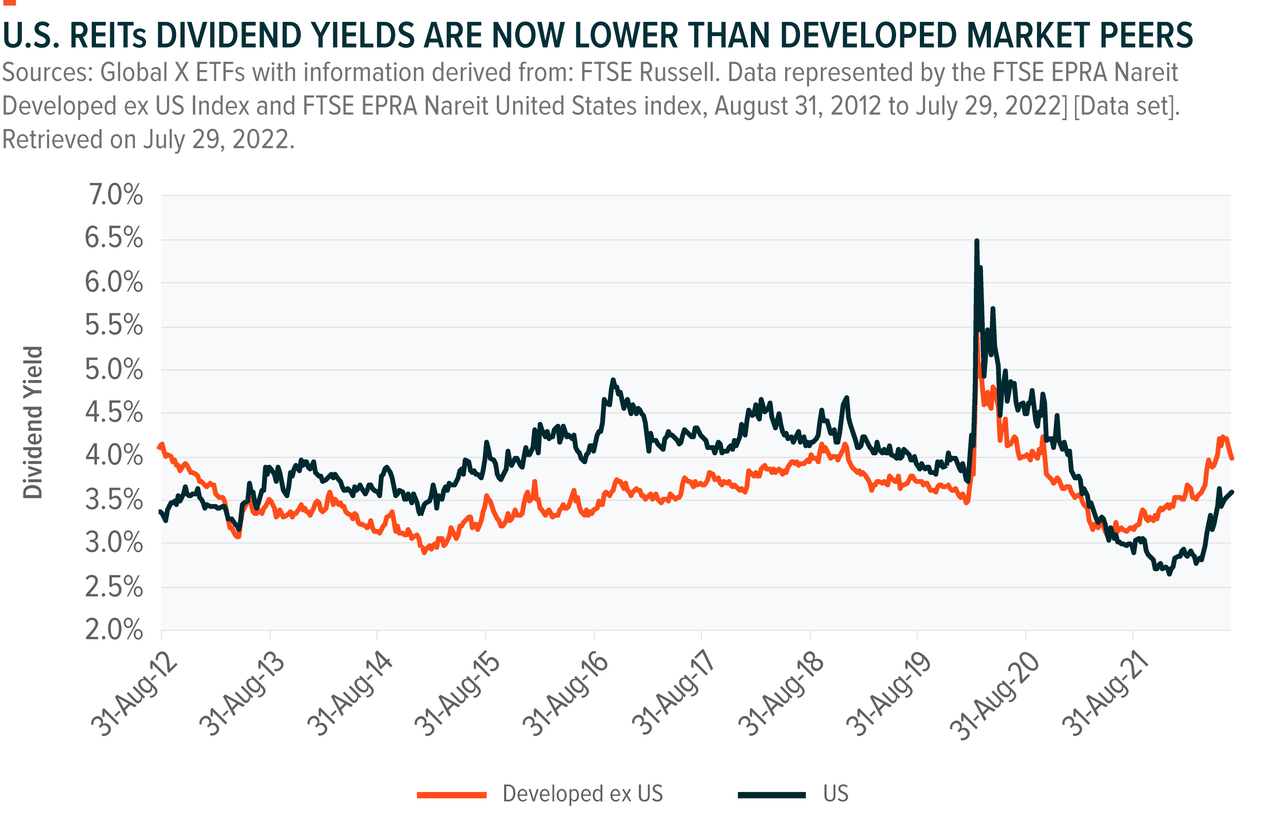
The REITs in these markets have more of a bias towards the diversified and office sub sectors than the U.S. The chart below compares the historic dividend yields of the US and international REITs, we can see that over the last 12 months international REITs have offered a higher dividend yield than the U.S.
Mortgage REITs (MREITs) are different from equity REITs in that they don’t own underlying property, but instead originate, own, and trade mortgage securities, and in doing so provide liquidity to the mortgage industry.
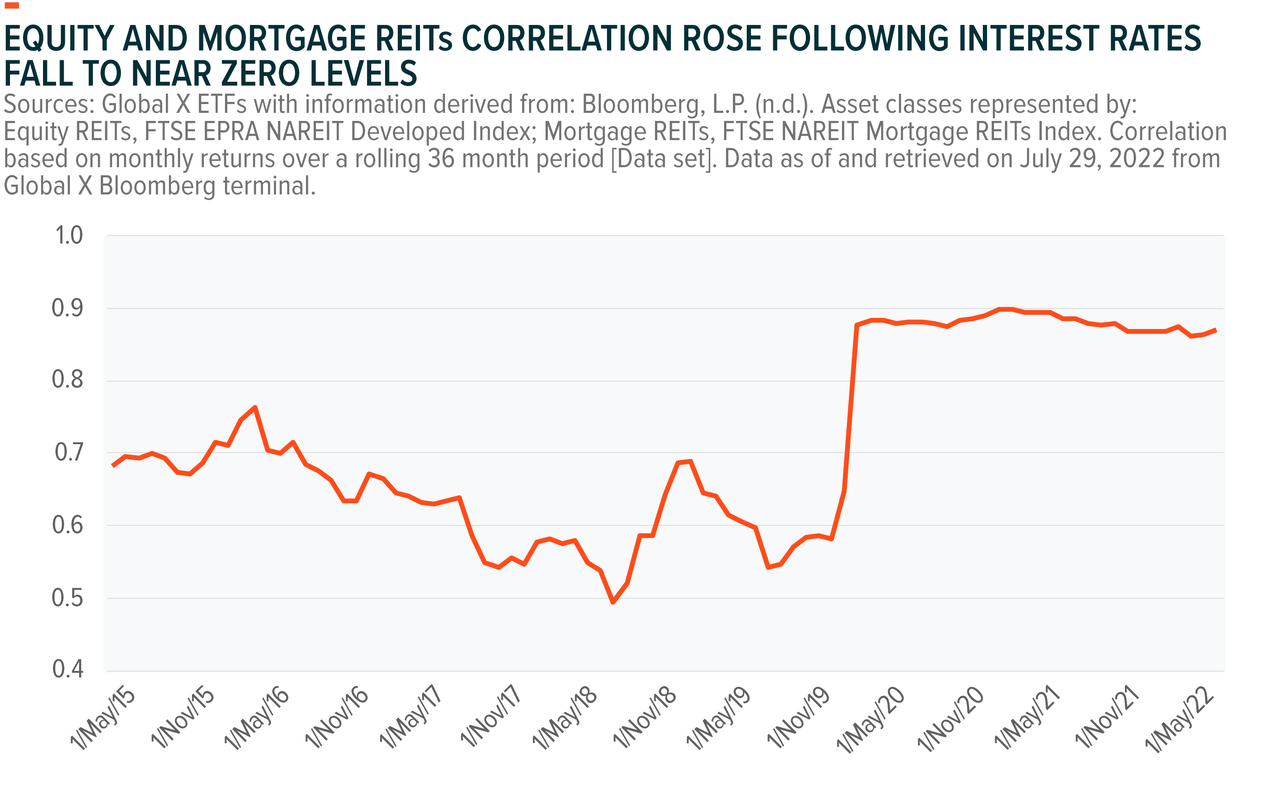
The correlation between MREITs and equity REITs is 0.84 over the last 5 years and 0.78 over the last 10 years.⁹ This relatively high correlation is driven by demand for mortgages tending to track low interest rates, which also tends to be a positive for equity REITs.
However, MREITs are also influenced by different variables than typical equity REITs. MREITs borrow money at short-term rates and invest in mortgage-backed securities (MBS) which pay a return typically linked to long-term interest rates, with the most common U.S. mortgage length fixed for 30 years.¹⁰
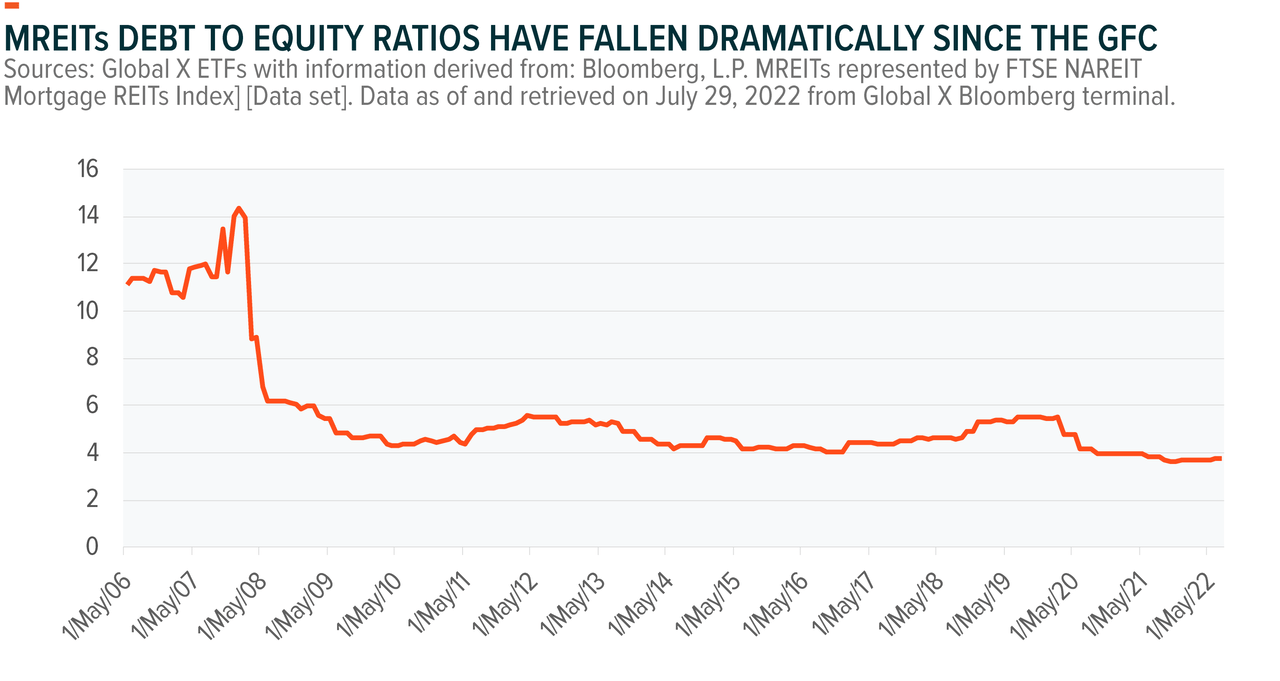
Importantly, for MREITs this borrowing creates a leverage effect which can boost returns when they are positive, or potentially result in losses, and is the driver behind MREITs offering such high dividend yields. While still leveraged, the leverage ratio of MREITs has fallen materially from around 11.0x prior to the Global Financial Crisis (GFC), to around 3.8x today.¹¹
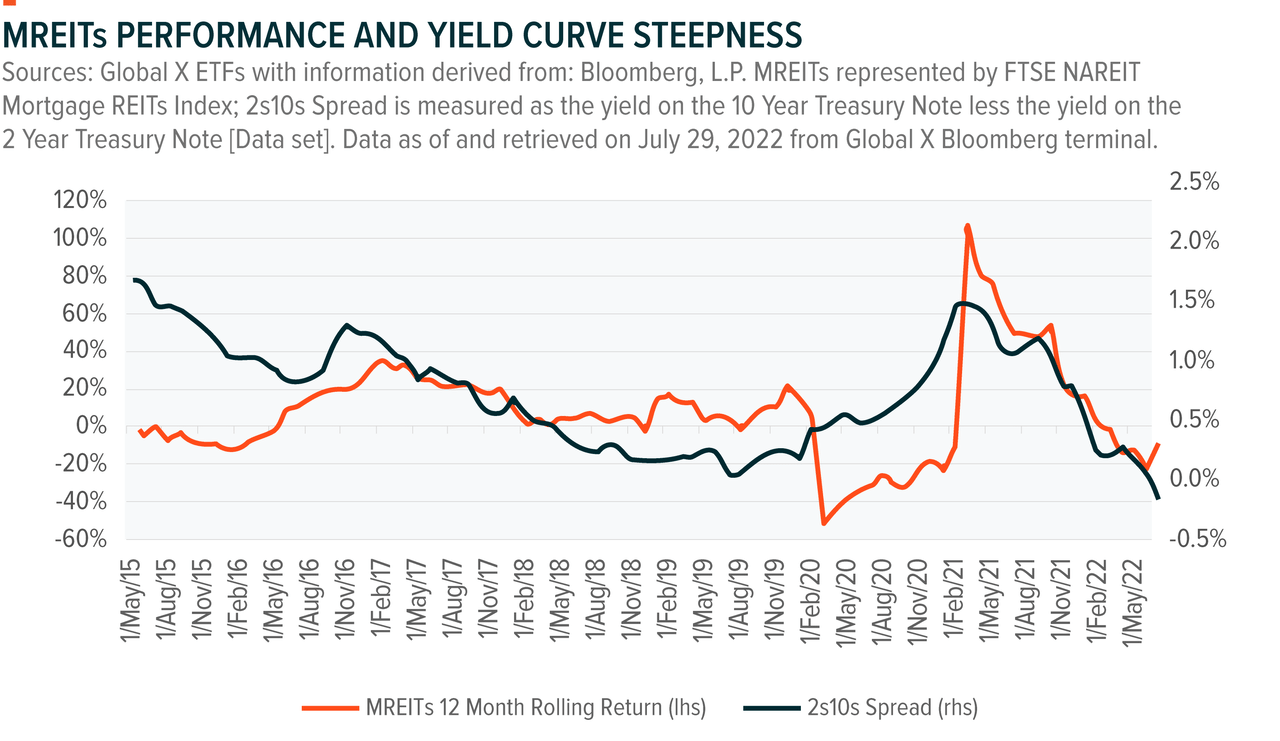
Interest rate volatility, as experienced in 2022, can impact MREITs’ performance. For example, the 2-year U.S. Treasury began 2022 at 0.78%, rising to 3.45% in mid June. The spread between 2 year and 10 year yields has ranged from +89bps to -48bps in 2022.¹²
Another headwind for MREITs this year is that the yield curve has inverted with short-term rates rising more than long-term rates. The chart below shows the steepness of the yield curve compared to rolling 12-month MREITs performance.
Mortgage REITs can offer attractive high yield potential due to their leveraged nature. The chart below shows that MREITs have offered yields of close to or above 10% for much of the past 7 years, materially higher than equity REITs.
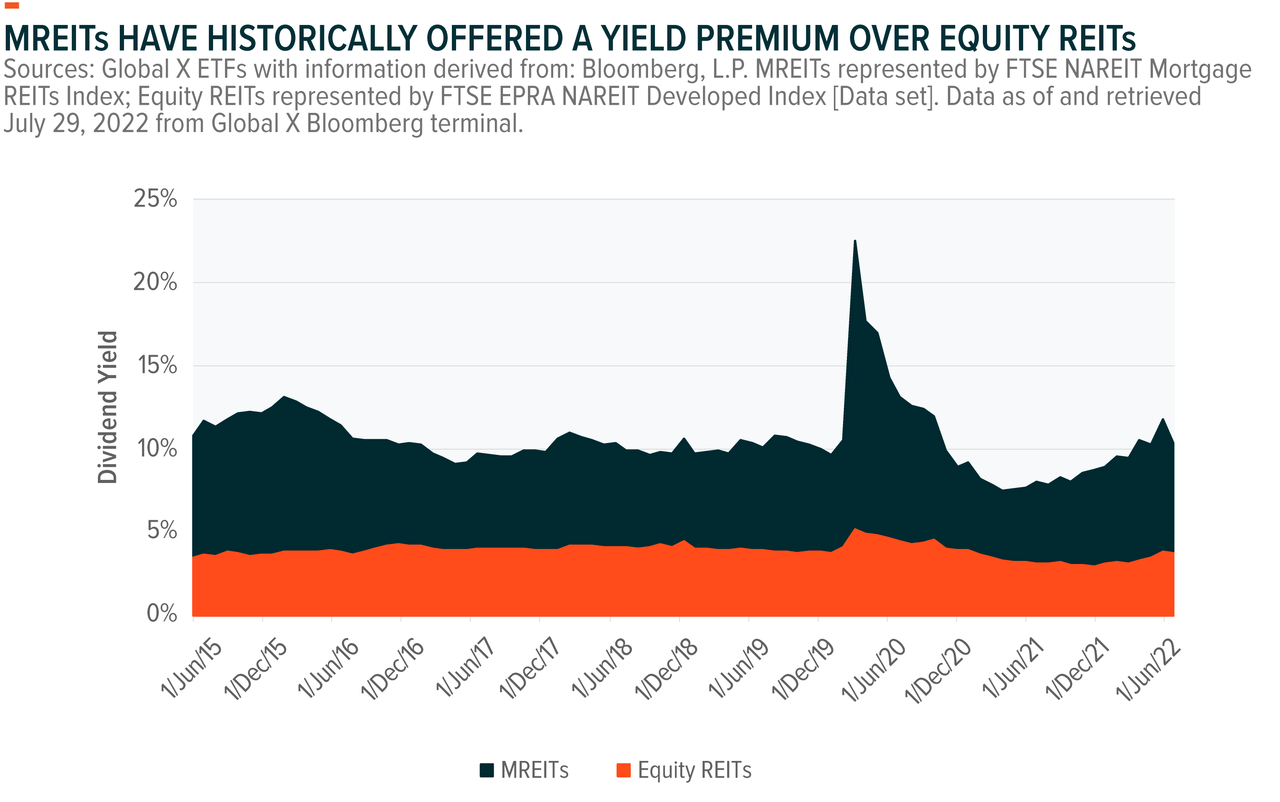
Equity REITs have outperformed broad equities year to date, with equity REITs down 6.0% and mortgage REITs down 13.1% compared to a decline of 13.1% for global equities.¹³ The general decline in risk assets has occurred as investors have looked to reduce risk exposures and sold equities – particularly those which may be more sensitive to rising interest rates, with the NASDAQ index falling by 20.7% over the year to date.¹⁴
We are positive on the outlook for REITs given their now attractive yields and yield pick-up relative to traditional fixed income and equity. Particularly relevant in the current macroeconomic environment is that REITs have a track record of outperforming broad equities when inflation is strong and increasing dividends at a faster rate than inflation on average. Also, we view MREITs as an attractive REIT portfolio diversifier and potential yield enhancer.
In this macroeconomic environment of high inflation, we view REITs’ regular income streams that tend to rise with inflation and high dividend payouts may help investors find higher and more stable income compared to other market segments.
Related ETFs
SRET: The Global X SuperDividend® REIT ETF invests in 30 of the highest dividend yielding REITs globally.
SDIV: The Global X SuperDividend® ETF invests in 100 of the highest dividend yielding equity securities in the world.
DIV: The Global X SuperDividend® U.S. ETF invests in 50 of the highest dividend yielding equity securities in the United States.
Click the fund name above to view the fund’s current holdings. Holdings are subject to change. Current and future holdings are subject to risk.
1. S&P Global Ratings. (2022, January 25). Industry top trends 2022: Real estate. Industry Top Trends 2022: Real Estate
2. Nareit. (2022). REITs by the numbers. Retrieved on August 17, 2022 from REITs by the Numbers
3. Nareit. (2022). Estimating the size of the commercial real estate market in the U.S. Retrieved on August 17, 2022 from Estimating the Size of the Commercial Real Estate Market in the U.S.
4. Powell, J.H. (2020, August 27). New economic challenges and the Fed’s monetary policy review. Board of Governors of the Federal Reserve System. Speech by Chair Powell on new economic challenges and the Fed’s monetary policy review
5. Bureau of Labor Statistics. (2022, August 10). Consumer price index – July 2022 [News release].
6. FTSE Russell. [FTSE EPRA Nareit Developed Index] [Data set]. Data as of and retrieved on July 29, 2022.
7. Fitch Ratings. (2022, August 5). Downtick of U.S. CMBS delinquencies in July. Downtick of U.S. CMBS Delinquencies in July
8. Bloomberg L.P. REITs represented by FTSE EPRA NAREIT Developed Index. Data as June 30, 2022. Data retrieved on July 29, 2022 from Global X Bloomberg terminal.
9. Bloomberg L.P. (n.d.). Mortgage REITs measured by FTSE Nareit Mortgage REITs Total Return Index, Equity REITs measured by FTSE EPRA Nareit Developed Total Return Index, correlation is based on monthly returns [Data set]. Data as of and retrieved on July 29, 2022 from Global X Bloomberg terminal.
10. Source: Saphir, A. (2022, April 11). Early signs of cooling housing market seen in some U.S. cities, Redfin says. Reuters. Early signs of cooling housing market seen in some U.S. cities, Redfin says
11. Bloomberg, as of 07.29.2022. Mortgage REITs measured as FTSE NAREIT Mortgage REITs Index. Leverage ratio measured as Total Debt/ Total Equity. Data from May 2006 to July 2022.
12. U.S. Department of the Treasury. (2022, July). Interest rate statistics. A negative spread indicates that the yield on the 2-year treasury is greater than that on the 10-year treasury.
13. Bloomberg L.P. (n.d.). Mortgage REITs measured by FTSE Nareit Mortgage REITs Index, equity REITs measured by FTSE EPRA Nareit Developed Index, global equities measured by MSCI ACWI Index. Returns from 31 December 2021 to July 31, 2022. [Data set]. Data retrieved on August 30, 2022 from Global X Bloomberg terminal.
14. Ibid.
FTSE EPRA NAREIT Developed Index: An index of listed income producing real estate equities from Developed Markets, weighted by free float market capitalization.
MSCI ACWI Index: An index of large and mid cap equities representing 23 Developed Markets and 24 Emerging Markets countries. The index covers approximately 85% of the global investable equity opportunity set.
Operating Margin: The ratio of operating income to total revenue. Operating income is revenue less cost of goods sold and operating expenses.
Capitalization Rate: A measure of property valuation, calculated as net operating income divided by market value. A higher figure implies a lower valuation.
Dow Jones U.S. Diversified REIT Index: Tracks the performance of publicly traded REITs that own and manage properties that contain a mix of uses, such as a mix of retail and office space.
Correlation: A measure that shows how two securities move in relation to each other. A correlation of 1 implies that the securities will exhibit the same price movements. A correlation of 0 means the securities demonstrate completely unrelated price movements.
NASDAQ: The Nasdaq-100 Index includes 100 of the largest domestic and international non-financial companies listed on The Nasdaq Stock Market based on market capitalization. The Index reflects companies across major industry groups including computer hardware and software, telecommunications, retail/wholesale trade and biotechnology. It does not contain securities of financial companies including investment companies.
Indices are unmanaged and do not include the effect of fees, expenses or sales charges. One cannot invest directly in an index.
Investing involves risk, including the possible loss of principal. Diversification does not ensure a profit nor guarantee against a loss. International investments may involve risk of capital loss from unfavorable fluctuation in currency values, from differences in generally accepted accounting principles, or from economic or political instability in other nations. Emerging markets involve heightened risks related to the same factors as well as increased volatility and lower trading volume. Narrowly focused investments typically exhibit higher volatility.
SRET may invest in an underlying fund that invests in companies that invest in real estate, such as REITs, which exposes investors in the Fund to the risks of owning real estate directly, as well as to risks that relate specifically to the way in which real estate companies are organized and operated. Real estate is highly sensitive to general and local economic conditions and developments, and characterized by intense competition and periodic overbuilding. Many real estate companies, including REITs, utilize leverage (and some may be highly leveraged), which increases risk and could adversely affect a real estate company’s operations and market value in periods of rising interest rates. The risks associated with real estate investment trusts including interest rate risk which may cause certain REIT holdings to decline in value if interest rates increase. REITs are subject to general risks related to real estate including default risk and the possibility of decreasing property values.
High yielding stocks are often speculative, high-risk investments. These companies can be paying out more than they can support and may reduce their dividends or stop paying dividends at any time, which could have a material adverse effect on the stock price of these companies and the Fund’s performance. SRET is non-diversified.
Shares of ETFs are bought and sold at market price (not NAV) and are not individually redeemed from the Fund. Brokerage commissions will reduce returns.
Carefully consider the funds’ investment objectives, risks, and charges and expenses. This and other information can be found in the funds’ full or summary prospectuses, which may be obtained at globalxetfs.com. Please read the prospectus carefully before investing.
Global X Management Company LLC serves as an advisor to Global X Funds. The Funds are distributed by SEI Investments Distribution Co. (SIDCO), which is not affiliated with Global X Management Company LLC or Mirae Asset Global Investments. Global X Funds are not sponsored, endorsed, issued, sold or promoted by Solactive AG or Indxx, nor do Solactive AG nor Indxx make any representations regarding the advisability of investing in the Global X Funds. Neither SIDCO, Global X nor Mirae Asset Global Investments are affiliated with Solactive AG or Indxx.
Original Post
Editor’s Note: The summary bullets for this article were chosen by Seeking Alpha editors.
This article was written by


