

peshkov
peshkov
On the 21st of September, The Federal Open Market Committee (FOMC) Meeting signaled a hike in rates. As the Meeting’s summary indicates, the prevailing expectation is that the rates could go higher in the coming quarters:
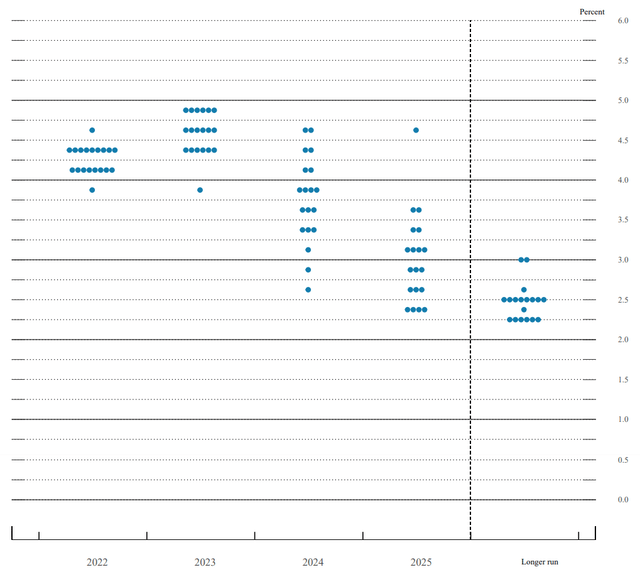
Source: US Federal Reserve System
Source: US Federal Reserve System
Now, the Federal Reserve also released inflation estimates that typically (at least in the present) don’t carry a lot of weight. These forecasts are predicated on the central bank being able to set “appropriate” monetary policy, which necessarily includes measures being able to limit price increases closer to an annual average of 2% over the next few years.
Rate hikes can (and sometimes do) go some way in mopping up the money supply needed to tame recession, but the current scenario indicates that a lot of work needs to be done to achieve this goal.
Early in August, the New York Federal Reserve indicated that Q2 saw loan defaults spiking in lower income areas:
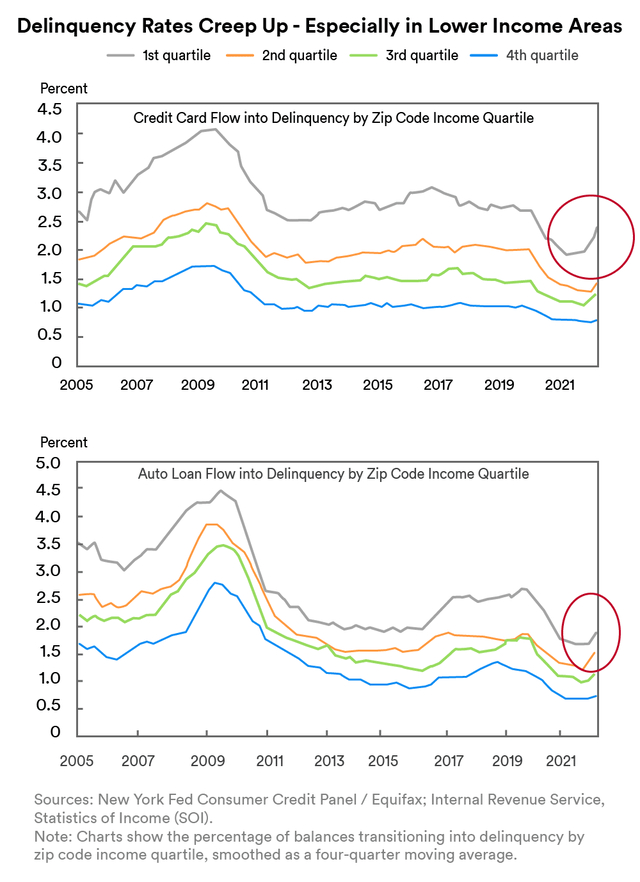
Source: Federal Reserve Bank of New York
Source: Federal Reserve Bank of New York
The least affected area codes in automobile and credit card defaults have been the “4th quartile” areas, i.e., the areas with the highest quartile in average income. All other quartiles have seen a surge in defaults, with the highest recorded in the “1st quartile,” i.e., the areas with the lowest average income ranges.
As per the New York Federal Reserve’s Center for Microeconomic Data that same week, Americans opened 233 million new credit card accounts in the April-June period, the most since 2008. In that same period, credit card balances increased 13% in the year-over-year, which was the highest in 20 years.
The Center also reported that U.S. household debt rose above $16 trillion in Q2 2022. Of the debt components, mortgage, auto loan, and credit card balances saw an increase over the past quarter while student loan balances remained largely unchanged.
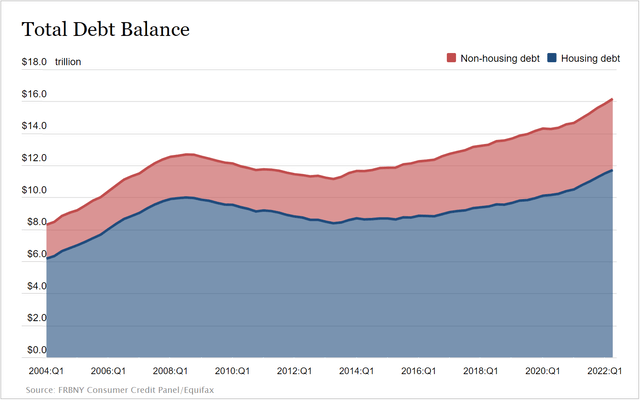
Source: Federal Reserve Bank of New York
Source: Federal Reserve Bank of New York
Over the long run, however, student loan balances have seen a steady increase over the years in the total mix of debt balances.
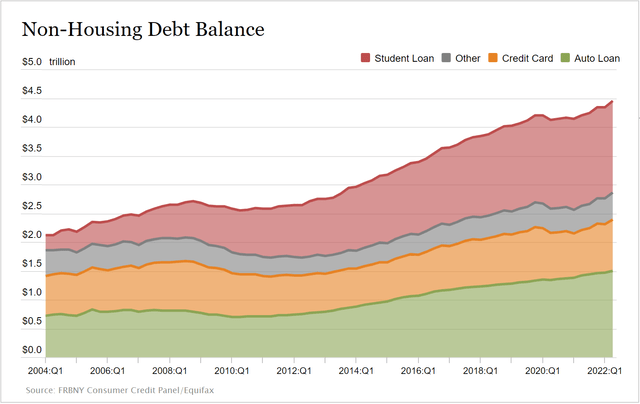
Source: Federal Reserve Bank of New York
Source: Federal Reserve Bank of New York
It bears noting that hospital services and college-related services have seen the biggest increase since the turn of the new century through Q2 2022.
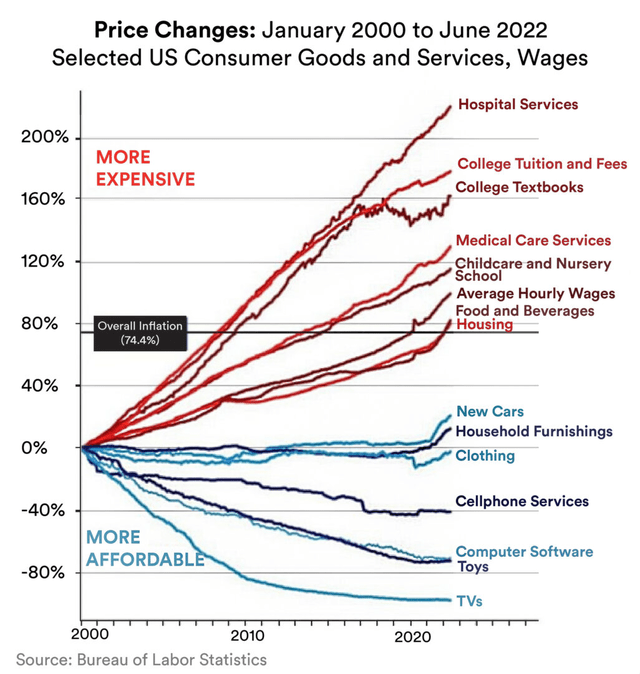
Visualization by American Enterprise Institute; Data by US Bureau of Labor Statistics
Visualization by American Enterprise Institute; Data by US Bureau of Labor Statistics
As per the U.S. Federal Reserve, the total amount of outstanding student-loan debt in the U.S. is around $1.75 trillion, of which 92% – around $1.6 trillion — is held by the government. This works out to about 6.5% of U.S. gross domestic product (GDP). Student debt, as a whole, has grown nearly threefold since the 2008 Financial Crisis.
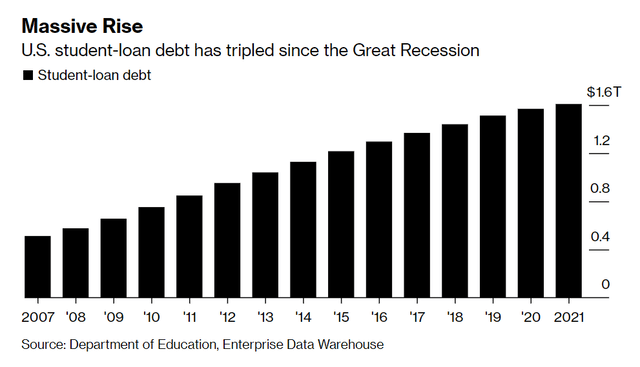
Visualization by Bloomberg
Visualization by Bloomberg
However, this threefold increase in student debt isn’t really supported by anywhere close to a threefold increase in college graduates. Long-term trends suggest that there has only been an 8-9% increase in college graduation since 2007/2008.
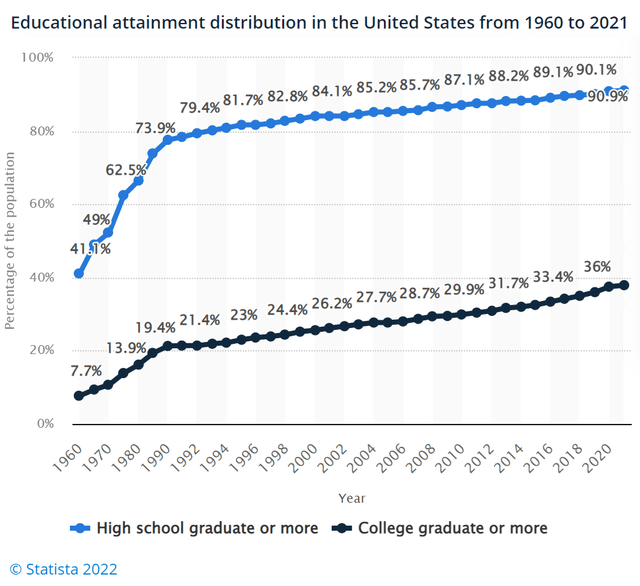
Visualization by Statista
Visualization by Statista
The student debt situation isn’t simply a “young person’s problem.” Debtors aged 50-61 held the third-largest pool of college debt and owed the largest average amount across all other age categories.
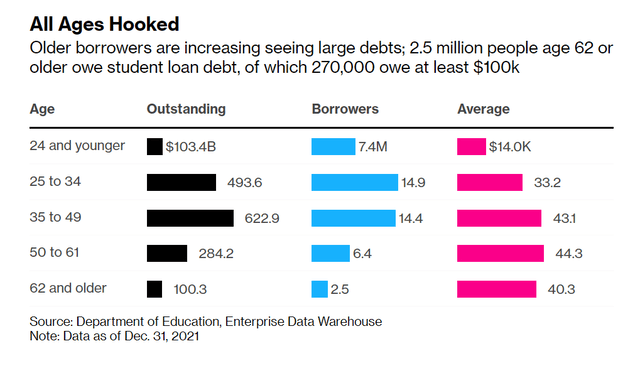
Visualization by Bloomberg
Visualization by Bloomberg
As the New York Federal Reserve noted, mortgage balances showed the biggest quarter-by-quarter increases within the total basket of household debt. The rising mortgage prices do have a correlated effect with the Federal Reserve’s rate hikes, but housing prices also play a part in denominating the principal owed. Over the course of the past year, median home sale prices have been trending down due to reduced demand.
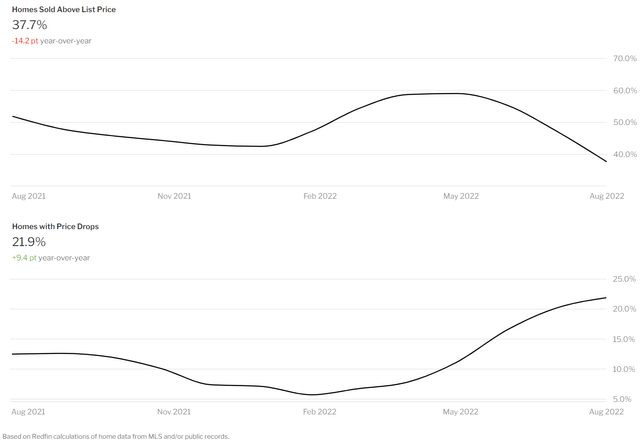
Visualization by Redfin
Visualization by Redfin
As a percentage of GDP, total household debt is estimated to be trending downwards since the highs seen during the height of movement restrictions and lockdowns during the pandemic.
Despite rising mortgages and student debt (where interest accumulates daily, unlike credit cards and mortgages), rates of serious delinquency were estimated at historical lows by the end of Q1. However, the Atlanta Federal Reserve warns that the trends shown mask “potential distress.”
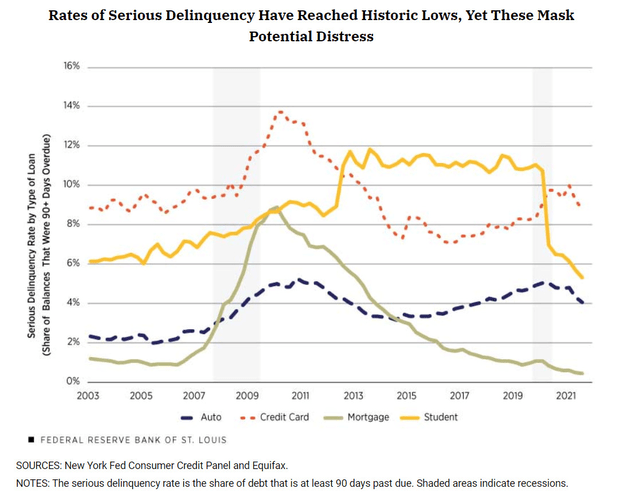
Source: Federal Reserve Bank of Atlanta
Source: Federal Reserve Bank of Atlanta
Now, it can be assumed that mid- to higher-income population segments are more likely to enter college. These segments are showing a tendency to pay down and “rationalize” their debts. In other words, the “higher income” college graduate population segment is increasingly more geared towards paying debt than building equity, while the “lower income” population segment is being priced out of building equity by loan defaults and the resultant economic costs. Despite different routes travelled by denizens on either end of a widening wealth gap, the result is largely similar: a reduced tendency to partake in high-priced goods and services across the board.
On the 24th of August, the U.S. administration announced a plan to staunch the drain on personal incomes due to student loans. As per the Penn Wharton Budget Model, a group of economists and data scientists at the University of Pennsylvania who analyze public policy to assess its economic and fiscal impact, the total cost of “forgiving” that debt could go up to $519 billion over the prospective 10-year horizon.
The proposed action is actually expected to have the biggest impact on debtors with the smallest amount of federal student loans. The more education one has, the higher the debt load tends to be. For people with larger debts qualifying for the program, their total debt servicing payments are scheduled to increase substantially once the moratorium on loan payments originally applied during the pandemic is lifted. It should be noted that, during this period, interest accruals didn’t stop.
As per Goldman Sachs economists Joseph Briggs and Alec Phillips, the following points bear keeping in mind:
If all borrowers eligible for the program enroll, student loan balances would reduce by around $400 billion, or 1.6% of GDP. This is more or less in line with the Penn Wharton Budget Model’s findings. Of course, historically, no federal assistance program has ever had full enrollment.
While lower-income households will see the largest proportional cut in debt payments, most of them don’t have student debt. Middle-income households will benefit the most but the sum effect is only $10,000.
Loan payments will fall from 0.4% of personal income to 0.3%. Goldman Sachs estimates only a 0.1% point boost to the GDP in 2023 with smaller effects in subsequent years.
While “debt forgiveness” with lower monthly payments is slightly inflationary in isolation, the resumption of payments is likely to more than offset this.
The cut in the size of many borrowers’ monthly payments when they resume in January would increase household disposable income while increasing the federal deficit. For instance, when payments resume in January, payments will increase by around $35 billion on an annualized basis instead of $55 billion.
The sum total of effects would lead to the deficit increasing by roughly $400 billion over the next two years. However, since the government has already funded those loans from its coffers, there will be no substantial impact on Treasury issuances.
While the proposed measures do bring some relief to a large number of people, said relief is quite limited. The fundamental problem with the college debt situation is the cost and not the debt itself. The fundamental problem continues to receive little determined effort in finding a remedy.
Despite over a year of steady inflationary pressure, neither Treasury nor the Federal Reserve have been willing to call the current situation a recession. The primary reason for this is the U.S. job market: data indicates that unemployment is low, thus rationalizing their argument that there is no recession.
On a purely technical basis, this argument holds water. However, on a qualitative basis, this argument has some worrying trends to contend with. As per a study published by the Economic Policy Institute (EPI) in August 2021, CEO pay in the U.S. has been skyrocketing relative to that of average worker pay (which includes both “working-class” and “middle-class” segments) since the mid-nineties.
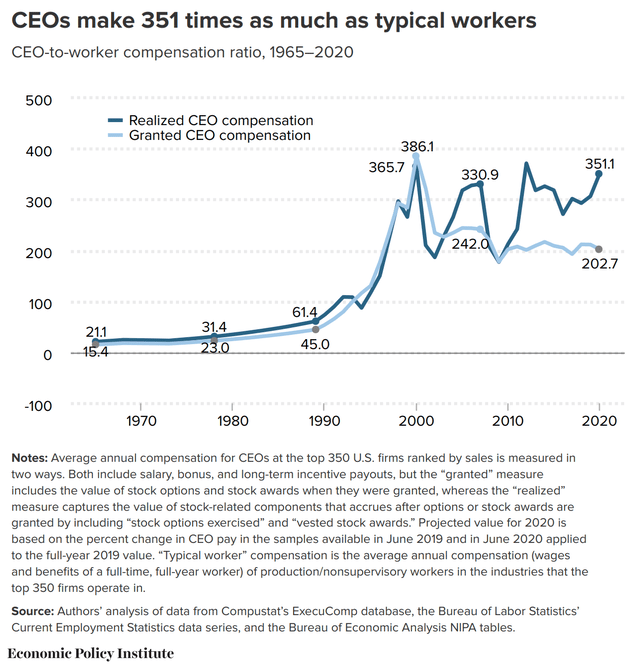
Source: Economic Policy Institute (EPI)
Source: Economic Policy Institute (EPI)
The same study also indicated that CEO compensation grew much faster than the earnings of the top 0.1% of wage earners in the country, thus statistically laying to rest arguments made by some circles that increasing CEO compensation also implies a commensurate increase in pay of “productive workers.” Data from 1978 to 2019 showed top 0.1% earners’ compensation growing 341% for the period, which is only a third as much as the 1,096% growth in realized CEO compensation. As of 2020, the gap was at a near-8 year high and trending further upwards.
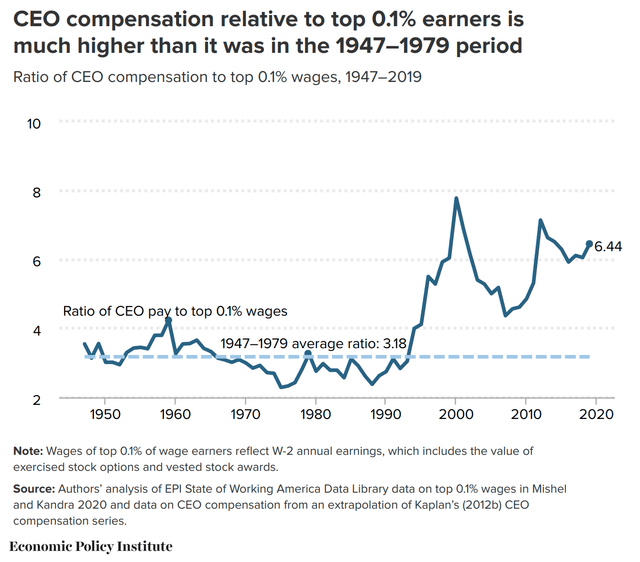
Source: Economic Policy Institute (EPI)
Source: Economic Policy Institute (EPI)
Interestingly, pay gap highs have nearly always been followed by an economic downturn in the 21st century, following which the pay gap rationalizes to a degree.
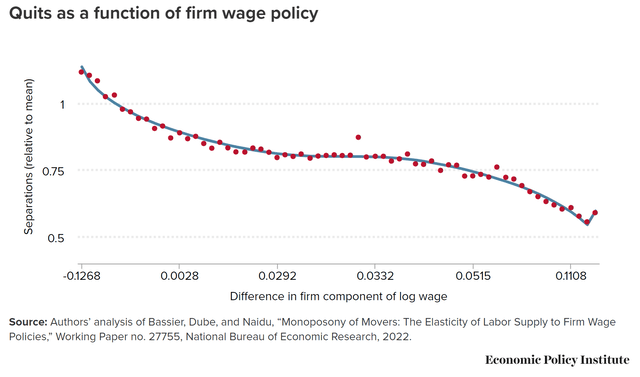
Now, the question of the pay gap has some relevance – intuitive but not neatly quantifiable – to the essence of engaging workers, boosting productivity and maintaining operational levels for a business. In another study published by EPI in May this year, the researchers arrived at an interesting conclusion: low wage earners are less likely to leave an employer and seek higher wages elsewhere.
Source: Economic Policy Institute (EPI)
Source: Economic Policy Institute (EPI)
When this tendency was analyzed in residual terms (i.e., by accounting for living costs across the board), it becomes clear that low-wage earners and very high wage earners are less likely to while those in the “middle class” are more likely to. While very high wage earners are more likely to have an inherent ownership interest, low wage earners typically used to find no significant upgrades in wages.
Given the middle class’ relative proximity to the top 0.1% wage earners and CEO – at least in terms of working relationships – this implies that the wage gap affects the middle class on a qualitative basis far more. However, in an inflationary setting, “labor elasticity,” i.e., the ability to jump from one employer to another, stiffens considerably. This leads to a phenomenon known as “non-engagement” wherein an employee does the bare minimum in order to remain employed and has no psychological connection to their workplace as opposed to those striving (“engaging”) to make personal gains via achievements. “Disengagement,” on the other hand, implies that employees feel their needs are not met.
Quick Note: Active social media users are probably aware of numerous TikTok videos in circulation that highlight workplace conditions and problems. Many of these TikTokers could be considered as “disengaged” workers.
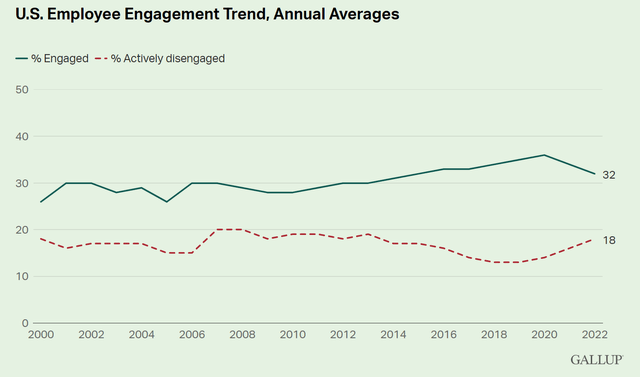
Earlier this month, survey specialist Gallup published the results of a survey which showed an interesting phenomenon: while average disengagement has largely stabilized, average engagement has been dropping for nearly two years now.
Source: Gallup
Source: Gallup
During Q2 2022, the proportion of “engaged” workers remained at 32% while the proportion of “actively disengaged” increased to 18%. The ratio of engaged to actively disengaged employees is now 1.8 to 1, the lowest in almost 10 years. Managers, i.e., those more likely to be “middle class,” experienced the greatest drop in engagement. This means that 50% of the U.S. workforce is “not engaged.”
Given the trends in “engagement” loss, productivity now becomes incumbent on fewer and fewer people than ever before. The intertwining factors are thus: with rising inflation affecting input costs and high CEO/top 0.1% wage earners pay comes pressure on maintaining bottom lines. “Managing” wages along “other ranks” becomes the go-to option in many cases.
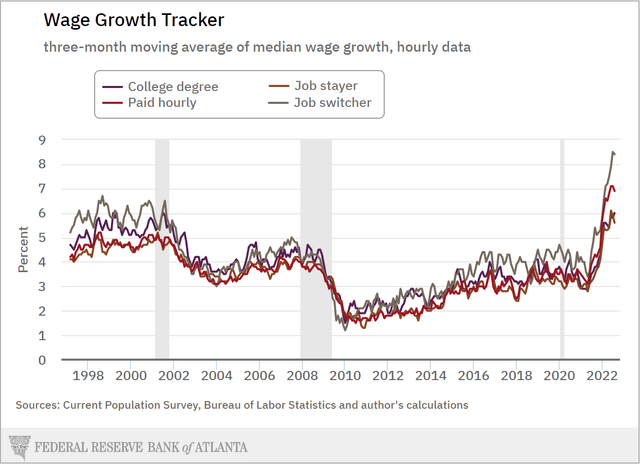
Interestingly, the Atlanta Federal Reserve’s Wage Growth tracker confirms this trend and adds a lot of interesting subtext to make inferences from.
Source: Federal Reserve Bank of Atlanta
Source: Federal Reserve Bank of Atlanta
Firstly, college degree holders – largely representing the “middle class” – hasn’t experienced as great an increase in wages as “hourly wage” earners. This shows that, despite a lesser elasticity being imputed, the “working class” is both keenly affected by inflation and demanding a redressal in their situation. Secondly, “job stayers” – generally long-term “active engagers” – have seen the least wage increase while “job switchers” – generally “non-engaged” workers – have seen the highest increase in wages.
Qualitatively, “active engagers” tend to be have a positive impact on company profitability. Sacrificing them on the altar of expediency, if true, is a dire indicator for economic outlook in subtle and not entirely quantifiable terms. There’s also another perspective: today’s “job switcher” is tomorrow’s “job stayer.” If “job stayers’” wages continue to flounder, increasing “active engagers” and stabilizing strong contributors will be increasingly difficult for companies. In this event, maintaining a positive outlook on corporate growth has yet another impediment.
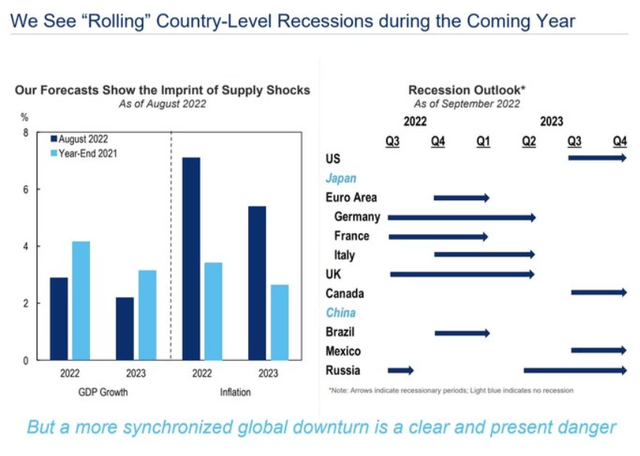
As is evident, the Federal Reserve has been monitoring trends – with concern – for quite some time. Major investment banks have been echoing these in their closed-distribution reports for some time now as well. For instance, Citi’s researchers (in a recent report not entirely reproducible on this platform) have warned that the Eurozone, Brazil and Canada will be entering recessionary periods in Q4 or shortly thereafter.
Source: Citi Research
Source: Citi Research
The researchers, interestingly, estimate the U.S. to be entering a “recessionary period” from Q3 of 2023 onwards, while Germany and UK are both indicated to already be in recession.
Also interesting is the conclusion that China isn’t in recession. While it’s entirely conceivable that the State will be loathe to declare it, estimates from its own Customs Bureau indicate exports to the U.S. (one of its largest trading partners) shrinking as consumption outlook diminishes.
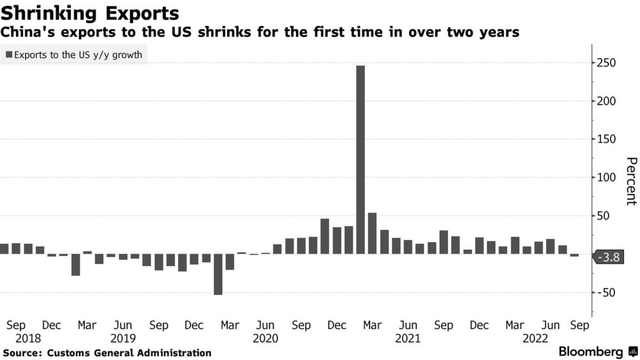
Visualization by Bloomberg
Visualization by Bloomberg
Infrastructure and exports are two very important pillars of the Chinese economy. However, it’s possible that there isn’t nearly enough reliable data – either from the State or via a large-scale study – for the researchers to make any prognostications about China.
In another report that is also not entirely reproducible, Deutsche Bank indicates its economic powerhouse homeland will likely be bearing the brunt of GDP shrinkage in the Eurozone in the next year.

Source: Deutsche Bank
Source: Deutsche Bank
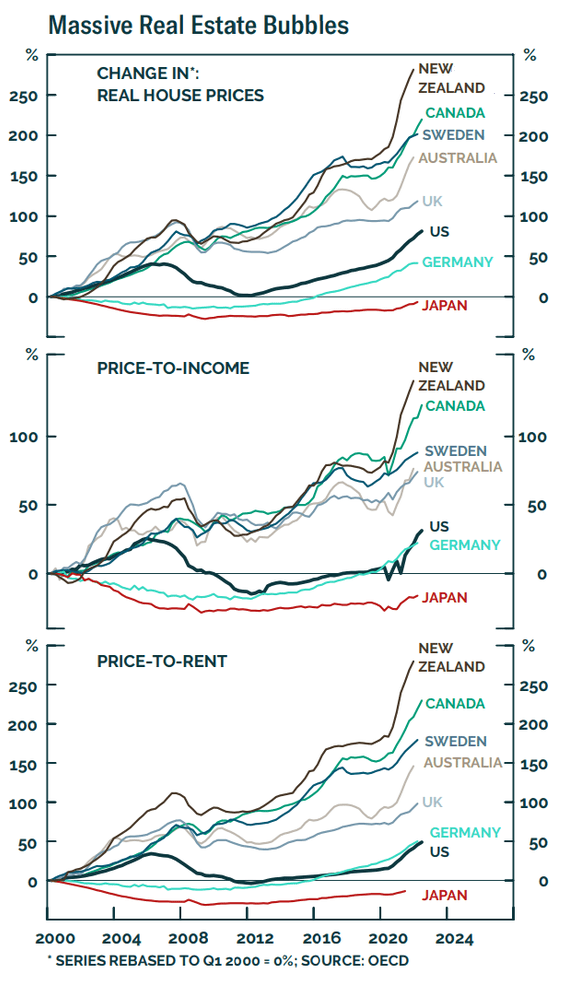
Furthermore, most major countries (except for Japan) are exhibiting “real estate bubble” behavior.
Source: Organisation for Economic Co-operation and Development
Source: Organisation for Economic Co-operation and Development
Given that this comparison seems to imply that the U.S. is not the most seriously inflated real estate market, whether each country’s real estate market is in a bubble is heavily dependent on localized factors and inextricably tied to average wage earnings and debt in those countries.
Overall, it bears remembering that the economy is a multi-factor interlocking network of inputs and outputs, some quantifiable and some qualitative. Holistically speaking, there is no “top-down” control system. The current scenario isn’t just economics, it is cultural and socioeconomic with some very hard questions that need to be addressed by society.
For instance, in the area of education, some pertinent questions would be: is a college education necessary for all “middle-class” jobs? If the college experience be a “cultural” necessity, how can costs be rationalized? Similar questions can (and should) be asked about the culture of wealth-keeping and compensation as well. The answers for these and other questions like these cannot be a carefully-cultivated statement by a legislator, commentator or economist. Instead, the answers for these lie in the “lived experience” of society as a whole. This would take awhile. Until then, the vulnerabilities highlight will be a persistent and recurrent feature.
While authorities have plenty of cause to not call “recession” on a technical basis, analysis by institutional houses that involves the bigger picture – the debt situation, the impact on spending and the housing market, the not-entirely quantifiable undertones of wages, et al – has given them enough ammunition to advise their clients to be wary. Hence, a term that has gained significant traction in the year till date to describe market conditions is “a retesting of lows.”
Nearly every major financial house worldwide is currently indicating a “retesting of lows” for U.S. and Eurozone equities. The reasoning behind this advisory is hard – both quantitatively and qualitatively – to argue with. While a recommendation to buy most equities cannot currently be made in good conscience, neither can a “sell.” With a long-enough holding period, any long-standing company equipped with strong fundamentals and operating in a core sector of the economy will prevail. Whether the valuations seen back in (let’s say) Q1 or Q2 2021 will return isn’t a provable given.
This article was written by
Disclosure: I/we have no stock, option or similar derivative position in any of the companies mentioned, and no plans to initiate any such positions within the next 72 hours. I wrote this article myself, and it expresses my own opinions. I am not receiving compensation for it (other than from Seeking Alpha). I have no business relationship with any company whose stock is mentioned in this article.
Additional disclosure: I lead research at an ETP issuer that offers daily-rebalanced products in leveraged/unleveraged/inverse/inverse leveraged factors with various stocks, including some mentioned in this article, underlying them. As an issuer, we don’t care how the market moves; our AUM is mostly driven by investor interest in our products.


