
ismagilov
ismagilov
I came across the iM DBi Managed Futures Strategy ETF (NYSEARCA:DBMF) while screening for commodity funds.
The DBMF ETF offers convenient access to the Commodity Trend asset class that most retail investors do not have access to. It has strong absolute and relative returns. The most attractive aspect of DBMF is its negative correlation to the market. I believe it is worth a look as a portfolio diversifier and as a supplement to the commodities portion of a well balanced portfolio.
The iM DBi Managed Futures Strategy ETF is an absolute return fund that seeks capital appreciation by engaging in long and short positions in derivatives, primarily futures and forward contracts, on a broad range of assets such as bonds, equities, commodities and currencies. The fund currently has $500 million in assets.
The DBMF ETF is an actively-managed ETF that seeks to generate absolute returns by following a ‘Managed Futures’ strategy. Managed Futures, for those not familiar, is a quantitative strategy that primarily employs trend-following or momentum strategies across a broad range of assets. The benefit of a managed futures strategy is that it can go long or short different asset classes so it typically has a low correlation to most traditional portfolios and can act as a portfolio diversifier.
DBMF’s positions are determined by a proprietary quantitative model called the ‘Dynamic Beta Engine’ that seeks to identify the main performance drivers of a selected pool of the largest commodity trading advisor hedge funds (“CTA hedge funds”). DBMF’s Dynamic Beta Engine analyzes recent performances of these CTA hedge funds to identify a portfolio of liquid financial instruments that reflect their estimated asset allocation with the goal of delivering performance similar to those CTA hedge funds.
DBMF may also invest up to 20% of assets in a wholly owned subsidiary that invests like an independent CTA hedge fund.
DBMF does not invest in cryptocurrency or digital assets and their derivatives.
Unlike actual CTA hedge funds which typically charge a 2% management fee and a 20% performance incentive fee, DBMF charges a 0.85% management fee and has a total expense ratio of 0.95%.
While the 0.95% expense ratio is expensive relative to vanilla equity funds like the SPDR S&P 500 Trust ETF (SPY), it is comparable to vanilla commodity ETF funds like the Invesco DB Commodity Index Tracking Fund (DBC), which has a 0.87% expense ratio.
Figure 1 shows the Fund’s holdings as of August 29th. Currently, the fund is long S&P 500 and WTI crude futures, while it is short the Euro, Gold, Emerging Markets, Bonds, and the Yen.
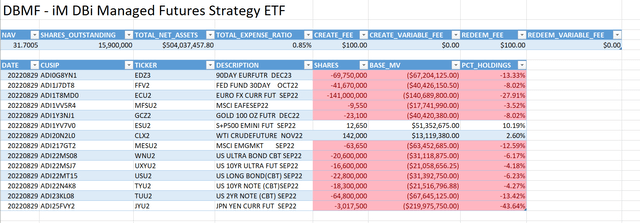
Figure 1 – DBMF August 29 Portfolio (imgpfunds.com)
Figure 1 – DBMF August 29 Portfolio (imgpfunds.com)
Note that as an actively managed ETF, DBMF’s holdings can change from day to day. Figure 2 shows the portfolio composition as of June 30. Notice that the Fund has flipped from short US equities to long US equities, while the Crude oil bet has been drastically reduced.
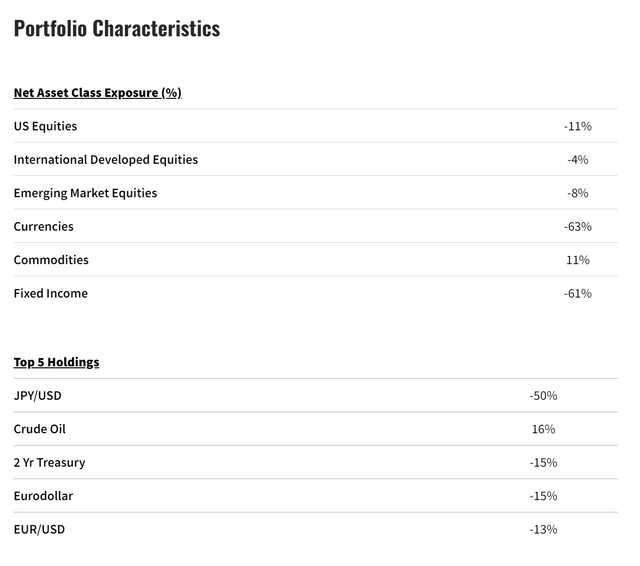
Figure 2 – DBMF June 30 Portfolio (DBMF June commentary)
Figure 2 – DBMF June 30 Portfolio (DBMF June commentary)
The DBMF pays out its ordinary income on a quarterly basis and capital gains annually. The distributions depend on fund performance. In 2021, the fund paid an annual distribution of $2.6772/share at the end of the year (Figure 3).
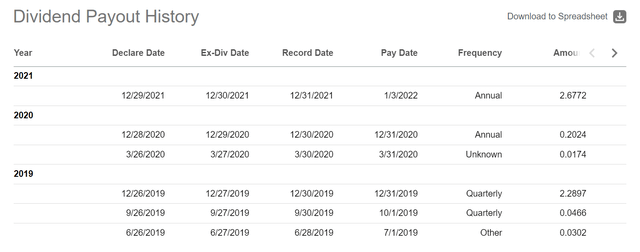
Figure 3 – DBMF historical distributions (Seeking Alpha)
Figure 3 – DBMF historical distributions (Seeking Alpha)
Although DBMF is a relatively young fund, with only 3 years of performance history, it has some pretty impressive returns, as shown in Figure 4. On a 3-Year basis to June 30, DMBF has delivered 15.0% average annual returns, significantly outperforming the SG CTA Index’s 10.4% and the Morningstar US Fund Systematic Trend peer group’s 7.7% in the same time frame.
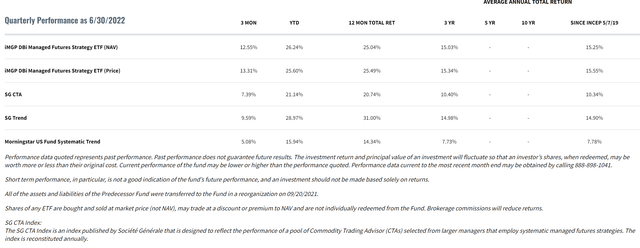
Figure 4 – DBMF Returns to June 30, 2022 (imgpfunds.com)
Figure 4 – DBMF Returns to June 30, 2022 (imgpfunds.com)
While anyone can make money in a bull market, what I find to be the most impressive with the CTA hedge fund asset class and DBMF in particular is their performance during 2020, arguable one of the toughest market environments of the past decade. 2020 had wild swings in various asset classes due to the COVID-19 pandemic, including the unprecedented move of near-month WTI futures briefly dipping into negative territory. Despite wild swings in the asset classes, DBMF and CTA hedge funds did not have major drawdowns.
Figure 5 shows comparison returns between DBMF, SG CTA, and Morningstar Systematic Trend indices since DBMF’s inception in May 2019. Notice that DBMF’s max drawdown in 2020 was 5.1%, experienced in June 2020, and the full year return was 1.8%.

Figure 5 – DBMF Returns vs. SG CTA Index (imgpfunds.com)
Figure 5 – DBMF Returns vs. SG CTA Index (imgpfunds.com)
The fund also performed well once the commodity bull market got under way, generating 9.8% returns in 2021 and 26.2% returns YTD to June.
In my opinion, the biggest risk with the DBMF ETF is the ‘black box’ nature of its proprietary ‘Dynamic Beta Engine’ and the size of its bets. Notice from Figure 1 that DBMF currently has a 44% net short in the Japanese Yen, and a 28% short in the Euro. These are very concentrated currency bets, if the Yen and Euro were to go against the Fund, losses can pile up quickly.
Furthermore, DBMF’s ‘Dynamic Beta Engine’ is backwards looking, as it analyzes the trailing performance of the largest CTA hedge funds to identify performance drivers and construct a replicating portfolio. If markets were to inflect and the CTA hedge funds change their positions, there may be a significant time lag before DBMF makes the same changes, as the sub-advisor does not have discretionary power to overrule the engine.
Finally, it is puzzling that the Fund’s current allocation does not contain many commodity positions. Instead, the majority of the portfolio positions are interest rates and currencies. However, the lack of commodity positioning is somewhat corroborated by CFTC data which shows WTI Oil future net speculative positioning is the lowest in many years due to recent volatility (Figure 6).
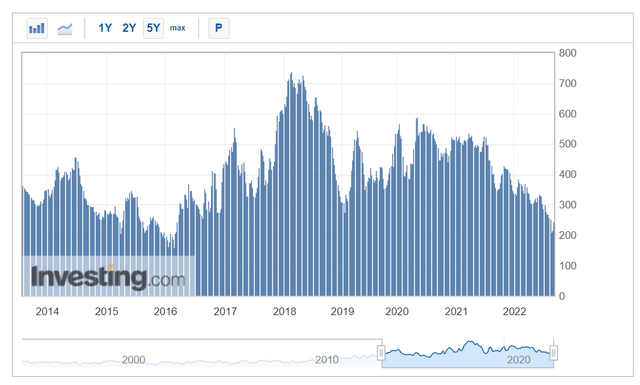
Figure 6 – WTI Oil Futures Net Speculative Positioning (investing.com)
Figure 6 – WTI Oil Futures Net Speculative Positioning (investing.com)
I personally invest a portion of my investments using the ‘Dragon Portfolio’ framework championed by Chris Cole of Artemis Capital Management (Note: Author is not affiliated in any way with Artemis). For those that are not familiar, I would highly recommend a read of their white papers on volatility and how to construct ‘Dragon Portfolio’ to last a 100 years.
Essentially, the main premise behind the Dragon Portfolio is that traditional asset allocation models such as the ‘Balanced Portfolio’ and ‘Risk Parity Portfolios’ depend on the negative correlation relationship between Bonds and Equities. However, this relationship breaks down when yields are at the zero bound (where we were recently) as increasingly risk-off episodes have seen both bonds and equities sell off.
The ‘Dragon Portfolio’ introduces additional asset classes such as ‘Long Volatility’ and ‘Commodity Trend’ and balances the asset class weights so that the portfolio can perform in all market environments (Figure 7).
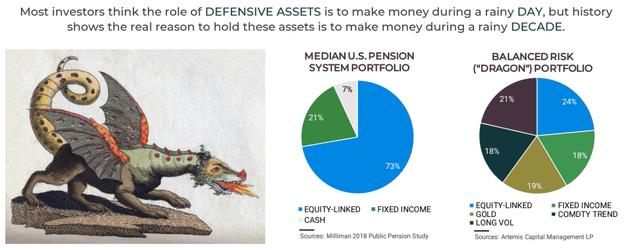
Figure 7 – Genesis of Dragon Portfolio (Artemis Capital Management)
Figure 7 – Genesis of Dragon Portfolio (Artemis Capital Management)
The toughest challenge in replicating the ‘Dragon Portfolio’ as a retail investor is a lack of access to products like ‘Commodity Trend’ that are traditionally only available to institutional or High-Net-Worth (“HNW”) investors. While a long-only commodity fund like the DBC ETF would have performed well in 2021 and 2022 YTD (41% and 26% respectively), it would have performed poorly in the past when commodities were in downtrends, like in 2014 and 2015 (DBC was down 28% in both years).
Using Portfolio Visualizer to compare between DBMF and DBC, we can see that DBMF may be a viable replacement/supplement for DBC in a balanced portfolio (Figure 8). True, DBC has a higher return CAGR in the period analyzed, but DBMF has better risk metrics such as volatility, max drawdowns, and sharpe ratio. Most importantly, it has a negative correlation with the market of -0.13. The downside with this analysis is that DBMF has only been around for ~3 years, so it is hard to draw concrete conclusions.

Figure 8 – Comparing DBC with DBMF (Author created with Portfolio Visualizer)
Figure 8 – Comparing DBC with DBMF (Author created with Portfolio Visualizer)
In summary, the DBMF ETF offers convenient access to the Commodity Trend asset class that most retail investors do not have access to. It has strong absolute returns and has performed well relative to its peer group. Most importantly, it has a negative correlation to the market, meaning it could perform well even during volatile market periods. I believe it is worth a look as a supplement to the commodities portion of a well balanced portfolio.
This article was written by
Disclosure: I/we have no stock, option or similar derivative position in any of the companies mentioned, but may initiate a beneficial Long position through a purchase of the stock, or the purchase of call options or similar derivatives in DBMF over the next 72 hours. I wrote this article myself, and it expresses my own opinions. I am not receiving compensation for it (other than from Seeking Alpha). I have no business relationship with any company whose stock is mentioned in this article.


